
Victoria d’Este
Posted: December 9, 2024 12:13 PM Updated: December 9, 2024 12:14 PM

Correction and fact check date: December 9, 2024, 12:13 p.m.
briefly
Bitcoin surged past $100,000, Ethereum reclaimed $4,000, and Toncoin had a quiet week despite updates on institutional support and adoption.

Bitcoin News and Macro
As you might expect, Bitcoin was definitely in the spotlight this week, breaking the long-awaited $100,000 barrier. The surge was fueled by institutional overconsent. The tremendous success of Bitcoin ETFs such as BlackRock’s iShares Bitcoin Trust has pushed confidence to new highs. BlackRock’s trust alone currently manages over 500,000 BTC worth $48 billion. This demonstrates the institution’s trust in Bitcoin.
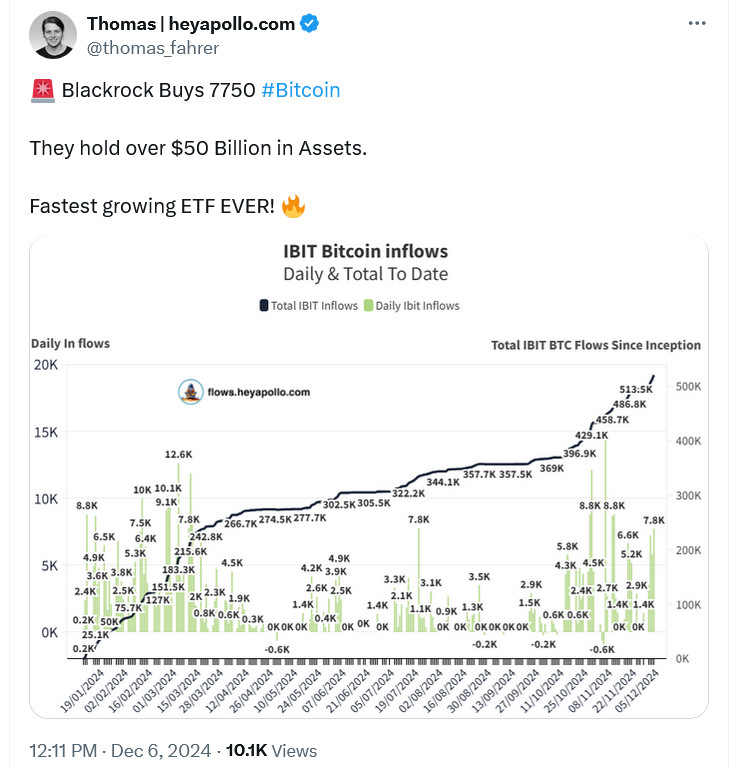
source: thomas driver
But the climb was not without drama. The sudden crash briefly sent BTC plummeting to $93,000, wiping out $303 million from long positions in a matter of minutes. However, Bitcoin proved its mettle by getting back into the $100,000 range. Analysts see this consolidation as a pause before the next round of upside, with the $115,000 target looming as liquidity continues to flood in.

At the time of publication, Bitcoin was trading at $96,410. Source: TradingView
MicroStrategy doubles down on its Bitcoin bet, securing $1.5 billion worth of BTC in one week.
MicroStrategy remains the largest corporate Bitcoin holder. Source: BitcoinTreasuries
These aggressive moves highlight a growing trend of companies using Bitcoin as a strategic asset to protect against inflation and currency risks. These bold acquisitions ripple through the market, sparking optimism and attracting new entrants from both institutions and retail.
You may have also heard about the martial law in South Korea, which triggered a sharp sell-off in the BTC/KRW pair. Therefore, Bitcoin remains sensitive to geopolitical shocks.
BTC/KRW activity of Korea-based cryptocurrency exchange Upbit. Source: Upbit
Meanwhile, El Salvador’s BTC holdings have surged, with unrealized profits exceeding $300 million. Of course, this is a strong validation of Bitcoin-first monetary policy. There are rumors of other countries considering similar moves.
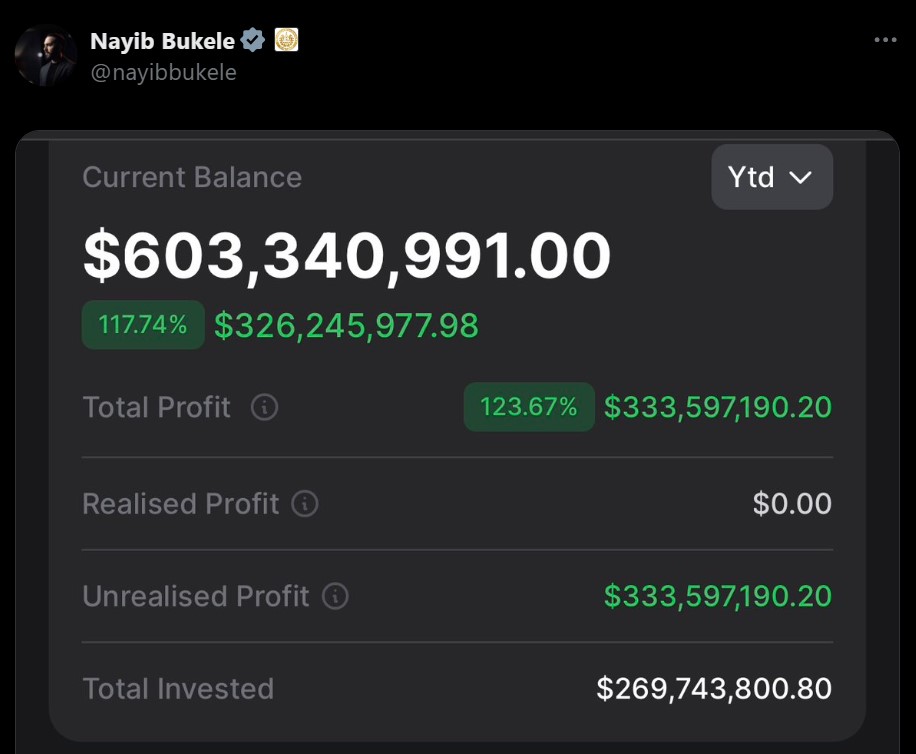
source: Naib Bukele
The broader picture shows Bitcoin consolidating its market dominance. With dominance rising to 57%, altcoins are taking a backseat and futures markets are abuzz with a bull market.
BTC price analysis
On the technical side, BTC spent the week teasing traders with its flirtation with the (once) legendary $100,000 milestone.
BTC/USD 1D chart, Coinbase. Source: TradingView
The initial break above $100,000 looked promising as the price rose to $102,000, but the rally quickly fizzled out. The seller eagerly stepped in and brought the price back to $97,000, and the buyer made his case. This withdrawal was not just technical. It felt like the market was testing whether the bulls had the resolve to defend their position.
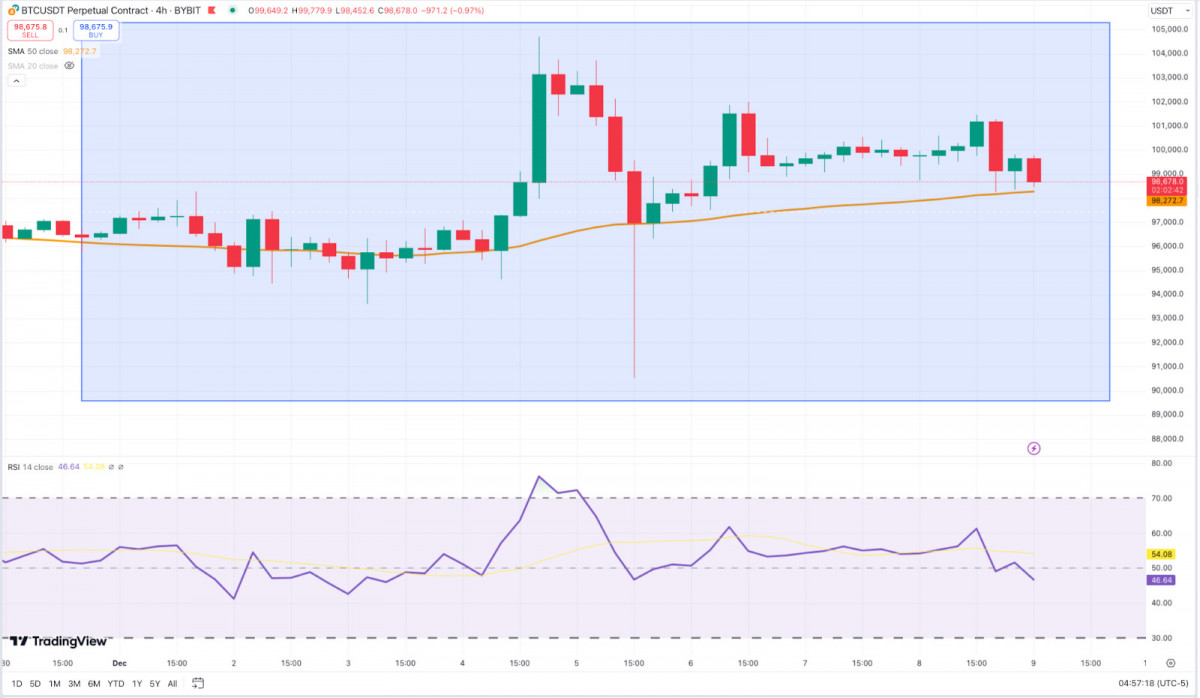
BTC/USD 4H chart, Coinbase. Source: TradingView
Zooming in on the 4-hour chart, BTC is locked in a tight squeeze between support at $97,000 and resistance at $100,000. A failed push above $100,000 turned into a textbook bear flag, hinting at a potential collapse if momentum weakens further. Nonetheless, buyers defended the 50-EMA in intraday moves, showing that there is life left in this range. A decisive break above $100,000 would open the floodgates for an advance towards $105,000, while a loss of $97,000 could trigger a decline below $95,000. Either way, this is not just a range, it’s a battlefield.
Ethereum News and Macros
Ethereum also attracted attention, regaining the $4,000 level for the first time since March. Institutional investors are flocking to the Ether ETF after it recorded massive inflows of $1.3 billion in two weeks.
source: Anthony Sassano
The $500 million increase in BlackRock’s ETH ETF holdings is a clear sign that Ethereum is not simply following Bitcoin’s lead, but is charting its own path as BTC surpasses $100,000.
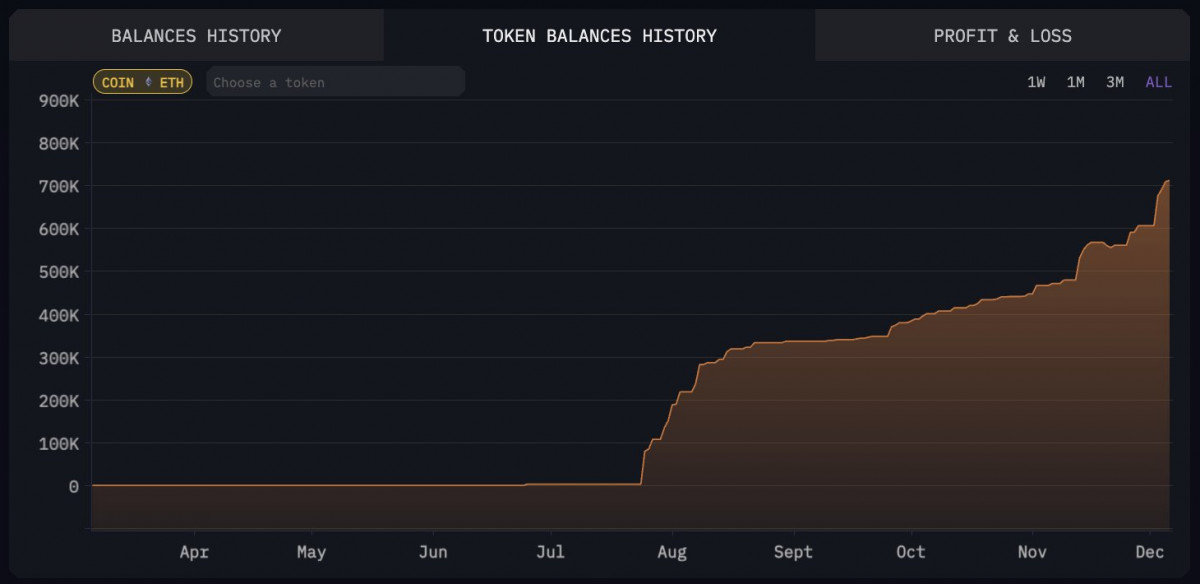
Holds Blackrock ETH ETF. Source: Arkham Intelligence
A rise above the $4,000 resistance is not just a psychological victory. We are paving the way for Ether to advance into uncharted territory.
The strengths of Ethereum compared to Bitcoin are also receiving attention. After months of delays, the ETH/BTC pair is showing signs of life. Experts are calling for a solid rebound in the coming months. This resurgence is underpinned by Ethereum’s fundamentals, including the increasing reliability of the beacon chain and a steady stream of advancements in layer 2 extensions.

The ETH/BTC ratio is up 9.14% over the past 30 days. Source: TradingView
Beyond the price action, Ethereum’s dominance in DeFi and NFTs remains solid. Weekly NFT sales exceeded $187 million, further demonstrating the network’s unparalleled diversity.
Top NFT collections by 7-day sales volume. Source: CryptoSlam
With trading volumes hitting new highs and the Ethereum ecosystem expanding, it is clear that Ethereum is still a long way from making a big move.
ETH price analysis
Speaking of movement, Ethereum’s battle over the $4,000 milestone has pretty much defined the past week. On the daily chart, the price has moved above the psychological level in an uptrend after several weeks of sideways trading.
ETH/USD 1D chart, Coinbase. Source: TradingView
But the failure to maintain a close above $4,000 signaled a change. The candle rejection and rising selling pressure suggested that the bullish momentum was waning. The 20-EMA acted as support during the rise, but is now under pressure. The broader uptrend remains intact above the 50-EMA, but a decisive close below $4,000 has turned into resistance, raising questions about near-term strength.
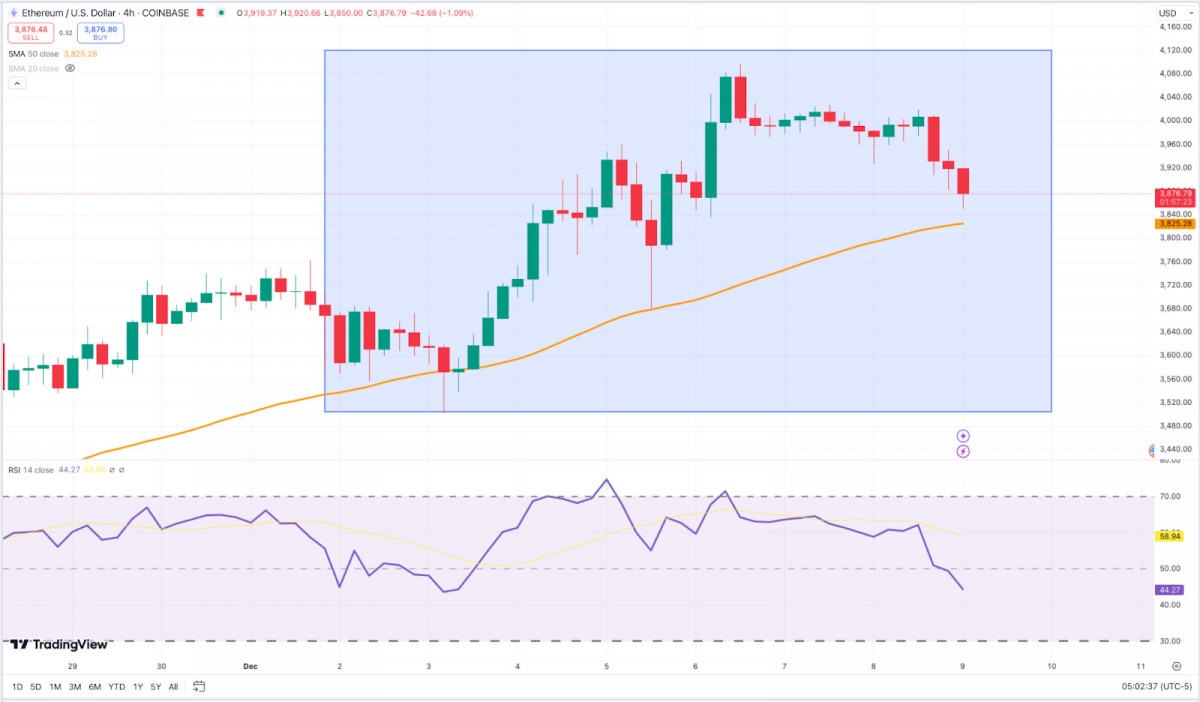
ETH/USD 4H chart, Coinbase. Source: TradingView
A false break above $4,100 on the 4-hour chart triggered sharp selling, with the 50-EMA serving as temporary support to the downside. The downtrend deepened as the descending triangle near $4,000 was broken. RSI reflected this change, falling into oversold territory and strengthening bearish momentum. Support around $3,840, linked to the previous daily low, is currently stabilizing the price action, suggesting the possibility of an accumulation. If the bulls are confident and can recover $4,000, it could set the stage for another test of $4,100. The market currently appears to be caught in a tug-of-war as it reassesses its confidence at this key level.
Toncoin News and Macro
For TON coin, it was a slow week with relatively few major developments. On December 3, Pantera Capital announced a record investment in the TON ecosystem, along with news that it had raised an additional $20 million for additional blockchain initiatives.
Source: Panteracapital.com
While this implied serious institutional support, the market barely budged.
The cooling in cryptocurrency sentiment has become more widespread.
A few days later, P2P.org announced an expansion to TON staking, allowing users to stake just 1 TON with no pool limit.
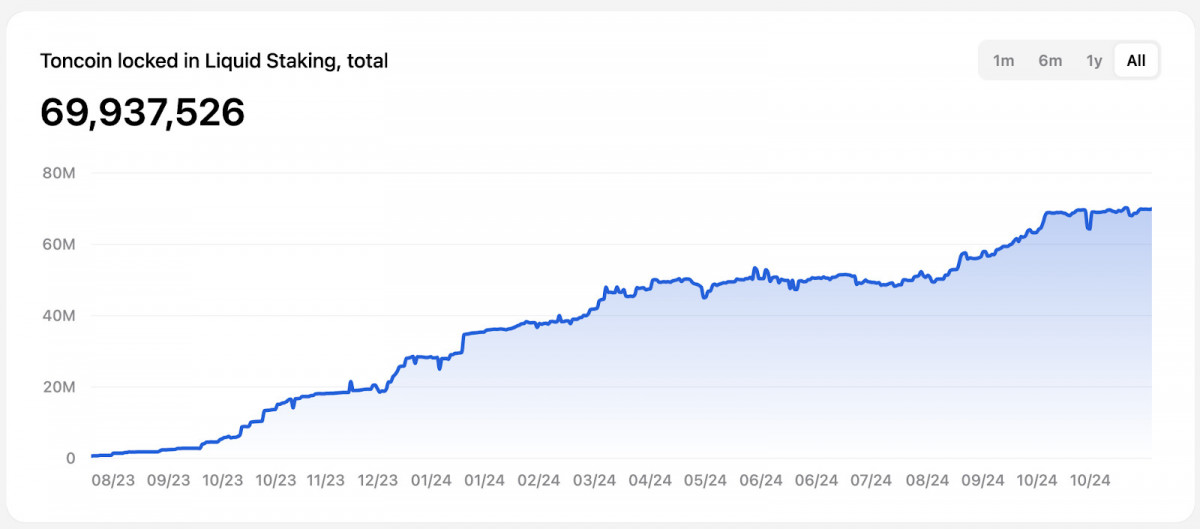
TON tokens are locked in the liquid staking protocol. Source: Tonstadt
This move improves the usefulness of TON by making staking more accessible. But once again, market reaction was disappointing, with even adoption-focused updates failing to produce much action this week.
Meanwhile, Telegram founder Pavel Durov testified in a French court on December 6 after his recent arrest. Although the case is not directly tied to TON, Durov’s blockchain connections keep this legal move on the radar of TON watchers. His comments expressing faith in the French legal system while remaining silent on the allegations had little effect on the coin.

Pavel Durov and his lawyer David-Olivier Kaminski arrive at the Paris Court of Justice on December 6, 2024. © THOMAS SAMSON / AFP
Yes, it was a quiet time for TON. But who knows? Maybe it’s the calm before the storm?
TON price analysis
On the 1D chart, Toncoin (TON) started the week with a sharp rally, breaking the $6.60 resistance line and rising toward $7 thanks to strong bullish momentum. The 20-day EMA supported this move by remaining well above the 50-day EMA. This is a classic sign of sustained rising pressure.
TON/USD 1D chart. Source: TradingView
However, momentum disappeared as the price approached the psychological barrier of $7. The clear rejection triggered a decisive selloff, breaking support at $6.70 and ending the week near $6.50. This is a bearish signal heading into next week. The $6.30 level, the previous pivot area from late November, now stands as important support, while $6.80 turns into immediate resistance.
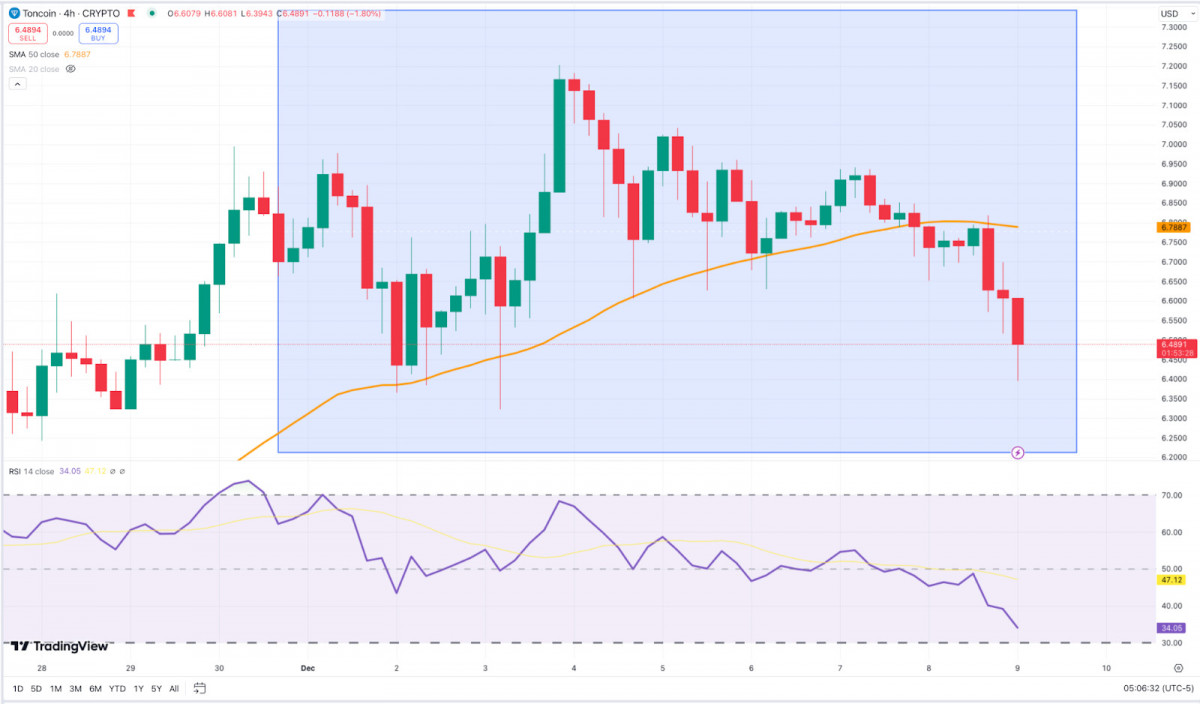
TON/USD 4-hour chart. Source: TradingView
The 4H chart shows the rally stalling with a rising wedge. This is a bearish setup that led to a collapse. The rejection of $6.80 accelerated the decline as the 50-EMA for this period shifted from support to resistance. The RSI has seen a downward shift from overbought to oversold as selling pressure intensifies. Key weekly levels ($6.50 and $6.30) are now pivotal. If $6.30 is abandoned, the next stop could be $6.00, which is the key demand area. The bulls will need to claw back $6.80 to regain control, but for now they are firmly down.
disclaimer
In accordance with the Trust Project Guidelines, the information provided on these pages is not intended and should not be construed as legal, tax, investment, financial or any other form of advice. It is important to invest only what you can afford to lose and, when in doubt, seek independent financial advice. We recommend that you refer to the Terms of Use and help and support pages provided by the publisher or advertiser for more information. Although MetaversePost is committed to accurate and unbiased reporting, market conditions may change without notice.
About the author
Victoria is a writer covering a variety of technology topics, including Web3.0, AI, and cryptocurrency. Her extensive experience allows her to write insightful articles for a wider audience.
more articles

Victoria d’Este

Victoria is a writer covering a variety of technology topics, including Web3.0, AI, and cryptocurrency. Her extensive experience allows her to write insightful articles for a wider audience.


