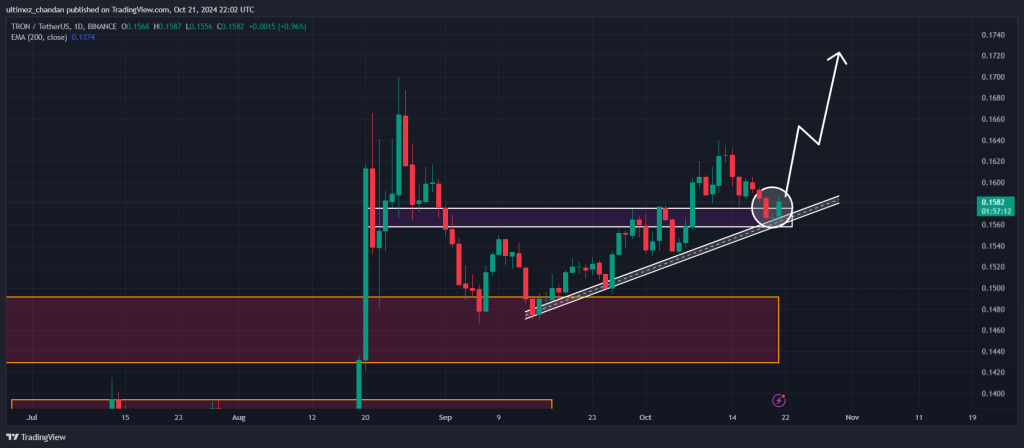
Amid price corrections across the cryptocurrency markets, Tron (TRX) has formed a bullish price action pattern on the daily chart. On October 22, 2024, TRX hit an all-time high while major cryptocurrencies like Bitcoin (BTC), Ethereum (ETH), and Solana (SOL) were struggling to gain momentum and forming a bearish pattern on the daily charts. Ready to record. .
Tron (TRX) technical analysis and future levels
According to expert technical analysis, TRX has formed a bullish Morningstar candlestick pattern at the critical support level of $0.156. The formation of this candlestick pattern caused asset sentiment to shift from bearish to bullish.

Based on recent price action and historical momentum, it is likely that TRX will rise 7% in the next few days and reach the $0.17 level. However, TRX’s relative strength index (RSI) and 200-day exponential moving average (EMA) suggest a potential rally and upward trend for the asset.
Bullish on-chain indicators
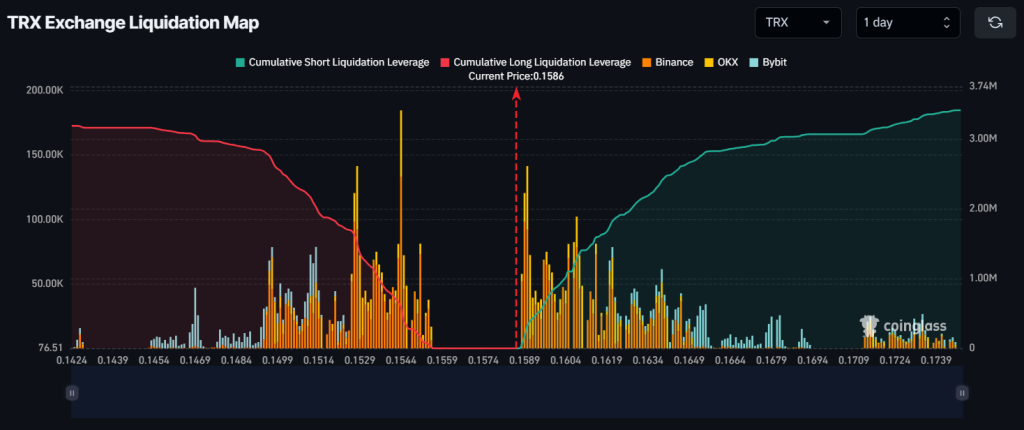
TRX’s positive outlook is further supported by on-chain indicators. According to on-chain analytics firm Coinglass, TRX’s long/short ratio is currently at 1.02, indicating optimism among traders. Additionally, open interest has increased by 4.2% in the last 24 hours, indicating growing interest from traders due to the bullish price action pattern.
According to Coinglass data, the current key liquidation levels are $0.154 at the bottom and $0.159 at the top, with traders using excessive leverage at these levels.

If sentiment remains unchanged and the price rises to the $0.159 level, nearly $319,510 worth of short positions will be liquidated. Conversely, if sentiment changes and the price falls to the $0.154 level, approximately $500,000 worth of long positions will be liquidated.
Current price momentum
At press time, TRX is trading near $0.158 and has experienced a modest price surge of over 1.25% in the past 24 hours. During the same period, trading volume surged by 70%, indicating increased participation from traders and investors amid bullish price action on TRX.

