

AAVE pared recent declines by surging 8% intraday, pushing the price back towards the $96 range as buyers decisively moved in near the $90-$95 demand zone. This move follows a prolonged phase of controlled selling in which prices continued to make lower highs before stabilizing near support. You can now see these changes on the daily chart. A strong candle signifies a clear rejection of lower levels and signals strong demand absorption.
AAVE price has now entered the first resistance level near $100, setting up a potential continuation if momentum continues. Interest has now shifted to a critical level as buyers hit rock bottom and structures begin to change. Can AAVE price regain $100 and extend higher gains?
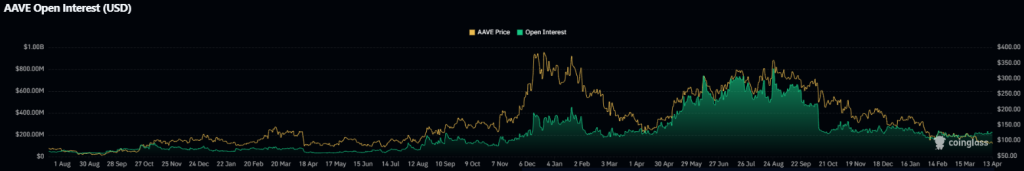
Derivatives positioning indicates early changes in market bias.
AAVE’s price rebound is currently supported by improving derivatives activity and points to a change in trader positioning rather than a short-term rebound. In the last 24 hours, volume increased 14.65% to $293.94 million and open interest increased 8.04% to $231.15 million, indicating new positions entered along with price strength. This means increased participation as the market reacts to a reversal in the $90-$95 demand zone.
At the same time, the positioning is slightly tilted towards shorts, with net longs being around 295.78K compared to net shorts of 345.10K. However, an important development is that the net delta has stabilized after a prolonged downtrend, meaning that the aggressive selling has begun to slow down. This setting often precedes directional expansion.
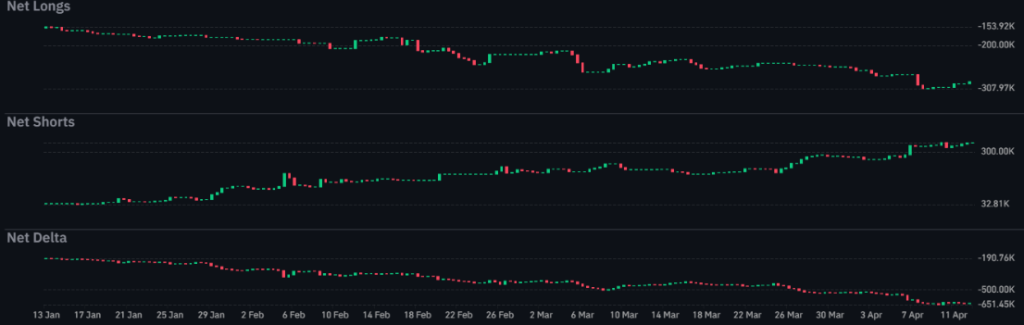
With shorts still rising but no longer under increasing pressure, the market has become increasingly sensitive to upward moves, especially near key resistance levels. Although the positioning imbalance remains, the change in momentum suggests that sellers are losing control on the margins.
AAVE Price Analysis: Building a reversal structure as $100 emerges as a breakout trigger
AAVE’s pricing structure is currently transitioning from a sustained decline to an early recovery phase. After a steady decline in recent weeks, the price has found support in the $90-$95 demand zone, where selling pressure is starting to dissipate. Rather than continuing its downward trend, AAVE has entered a stabilization phase, signaling supply absorption and exhaustion among sellers.
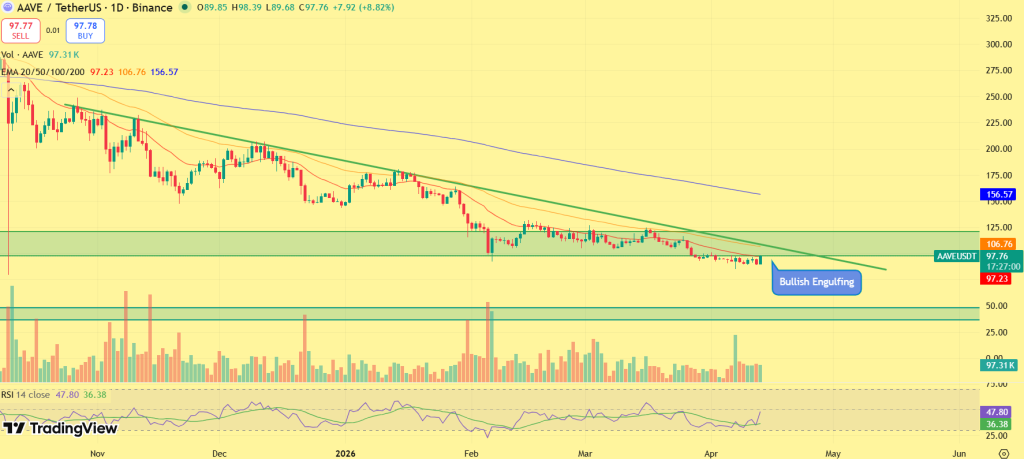
This change became decisive with the formation of a bullish candle, which signaled a strong reaction from buyers and the first significant breakdown of the bearish structure. Currently, the AAVE token is approaching its 20-day moving average near $97-$98, which acts as the first resistance level. A sustained break above this area would confirm near-term momentum strengthening.
However, the definition level remains at $100. This level is consistent with previous collapse structures and acts as a psychological barrier where a significant number of short positions are likely to become concentrated. A break above $100 would not only confirm a structural reversal, but could also trigger a short-term covering rally, accelerating the price towards the next resistance cluster. If momentum extends, the next upward zone will lie near $110 to $115, where the 50-day moving average and previous supply converge.
The downside is that the $90-$95 range is still an important support level. A break below this area will invalidate the current recovery structure and revert the market to a bearish continuation. The structure has changed, but confirmation now depends entirely on $100 strengthening.
AAVE Price Forecast: $100 will be the line that defines the next move
AAVE is now at a major inflection point, trading between firm support at $90-$95 and resistance at $100. A break above $100 could quickly generate momentum, aided by structural confirmation and the possibility of liquidating short positions, opening a path to $110 and above. However, failure to recover this level may limit the price range in the near term. A recovery is underway, but $100 is still the level that will determine whether this will be a breakout or another bounce.
Trust CoinPedia:
CoinPedia has been providing accurate and timely cryptocurrency and blockchain updates since 2017. All content is produced by an expert panel of analysts and journalists following strict editorial guidelines based on EEAT (Experience, Expertise, Authority, Credibility). All articles are fact-checked against reputable sources to ensure accuracy, transparency and reliability. Our review policy ensures unbiased evaluations when we recommend an exchange, platform, or tool. We strive to provide timely updates on all things cryptocurrency and blockchain, from startups to industry majors.
Investment Disclaimer:
All opinions and insights shared represent the author’s own views on current market conditions. Please do your own research before making any investment decisions. Neither the author nor the publication is responsible for your financial choices.
Sponsorship and Advertising:
Sponsored content and affiliate links may appear on our site. Ads are clearly visible and our editorial content is completely independent of our advertising partners.