How good is this setup? Test for Forex, Indices, Metals, Bonds and Energy stocks.
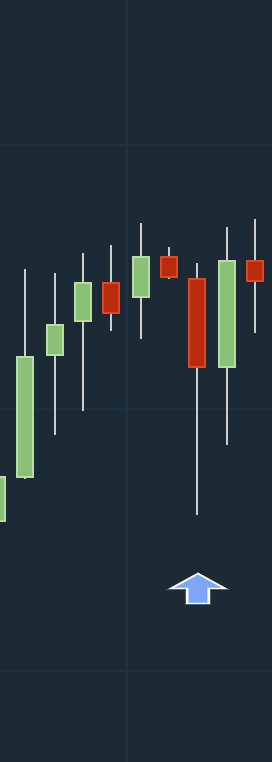
Above is the EURCHF forex pair on the 4-hour chart. I decided to only trade 4-hour candlesticks for long-term fractal positions because they provide better indicators.
Sell signals are highlighted with blue arrows.
Basically, the arrow reversed the uptrend by falling below the low of the previous bar and the low of the bar three candles away. This concept will be explained in more detail in the final section (see link at the end of this article).
I placed a sell order just below the closing price of this red bar.
It triggered and I went short, but unfortunately it reversed and stopped me at minus £720.
Above is a fractal of EURGBP.
Again the red bar reversed the uptrend and closed below the previous three bars.
It then entered a range before falling significantly to the downside.
I am now close to breaking even and have now added up to a profit of £729 and hope to get a few legs down before I close.
Otherwise I will be expelled.
Finally, there was selling on EURUSD, which reversed the bullish advance and is currently at breakeven within the range.
The daily chart shows a gradual downward trend, so I hope we can capture this momentum.
We are also testing the FTSE 8th and 13th bar strategy pioneered by Tom Hougaard.
At first it took a while to get back up.
I’m starting to wonder if I’m getting the wrong end of the range.
The yellow lines are buy and sell points. I was shocked by the short part…

