
NAIROBI (Coinchapter.com) – The US Dollar Index (DXY) is currently trading around 106.19, signaling a breakout from a potential giant diamond bottom formation. This technical pattern suggests strong bullish sentiment surrounding the dollar as the index continues to maintain upward momentum.
First-quarter growth figures for the U.S. economy suggest a resilient trajectory, with increased consumer spending backed by robust labor demand. Driven by sustained growth and persistent inflation, the Federal Reserve is signaling change. The expected policy rate easing appears to be on hold, reflecting a bias to maintain the current position for longer than previously thought.
Retail sales surge, reflecting economic momentum
U.S. retail sales increased 0.7% in March 2024 compared to the previous month, exceeding expectations of 0.3%, indicating continued consumer confidence. This follows a revised 0.9% rise in February. Showing strength in eight out of 13 categories, the data suggests continued momentum in consumer spending.
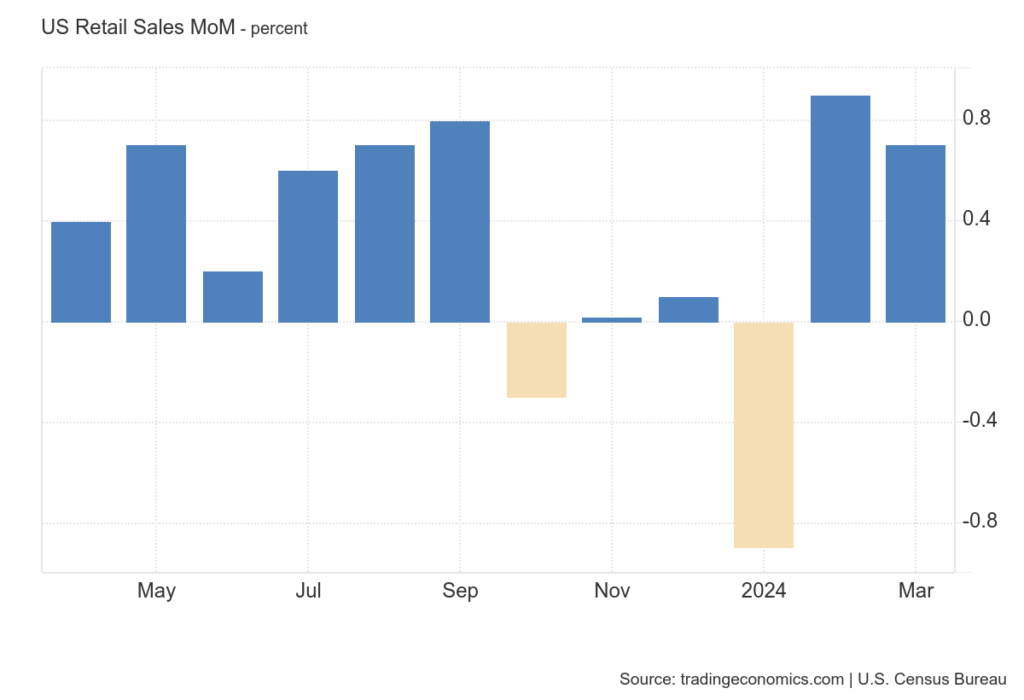
Sales increased significantly at non-store retailers (2.7%), gas stations (2.1%), general store retailers (2.1%), and building materials and garden equipment (0.7%). Gains were also recorded in food and beverage stores (0.5%), health and personal care stores (0.4%) and food service and drinking establishments (0.4%). On the other hand, sales decreased in sporting goods, hobby, musical instrument and book stores (-1.8%), clothing (-1.6%), electronics (-1.2%), and general stores (-1.1%). , automobiles (-0.9%), furniture (-0.3%).
Core retail sales rose unexpectedly 1.1%, signaling strong consumer confidence despite economic concerns. This could lead to higher GDP forecasts, ahead of January's growth rate. Even in the absence of highly volatile sectors, sales rose 1%, indicating the market is resilient.
DXY Technical Points for Overbought Conditions
The US Dollar Index (DXY) presents an interesting picture to technical analysts as it approaches an important resistance area. On the weekly chart, a diamond-shaped bottom pattern appears to be forming, a technical pattern that can often signal an uptrend reversal.
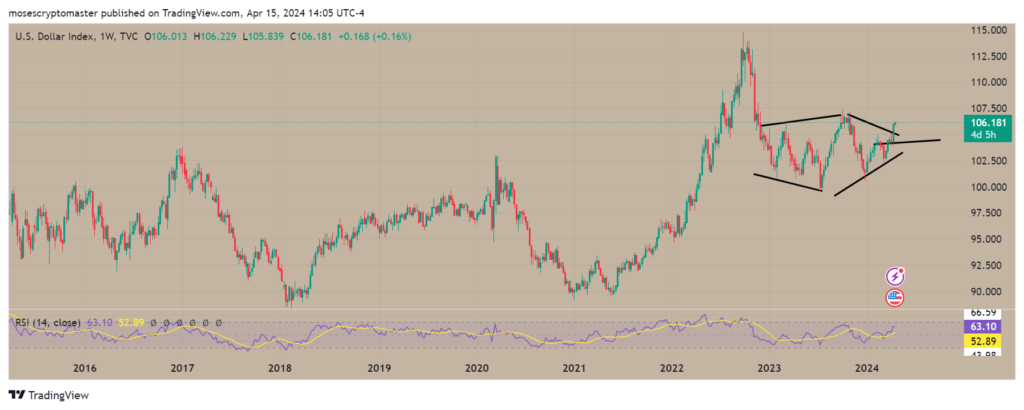
The US Dollar Index (DXY) is currently trading around 106.19, signaling a breakout of a potential giant diamond bottom formation. This technical pattern suggests strong bullish sentiment surrounding the dollar as the index continues its upward momentum.
The Relative Strength Index (RSI) on the daily chart indicates that the DXY is overbought, suggesting strong buying activity recently. This trend can lead to a correction if buyers lose momentum. At the same time, Moving Average Convergence Divergence (MACD) shows increasing green bars, confirming strong buyer momentum. This pattern often precedes a sustained upward move, but requires caution for potential downturns.
The post DXY Breaks Out of Diamond Bottom, Bullish Momentum Signal appeared first on CoinChapter.