
On-chain data shows a surge in Bitcoin whale trading following the recent rally, a sign that profit-taking may have begun.
Bitcoin whale trading volume hits 10-week high.
Data from on-chain analytics firm Santiment shows an increase in activity from Bitcoin whales recently. The indicator of relevance here is the “whale transaction count,” which tracks the total amount of transfers taking place on the BTC blockchain with a value of at least $100,000.
A high value of this indicator means that whales are currently making a lot of movement in the network. This trend means that these huge holders have an active interest in trading the coins.
On the other hand, a low indicator suggests that whales may not be paying much attention to cryptocurrencies at the moment as they are not trading too much.
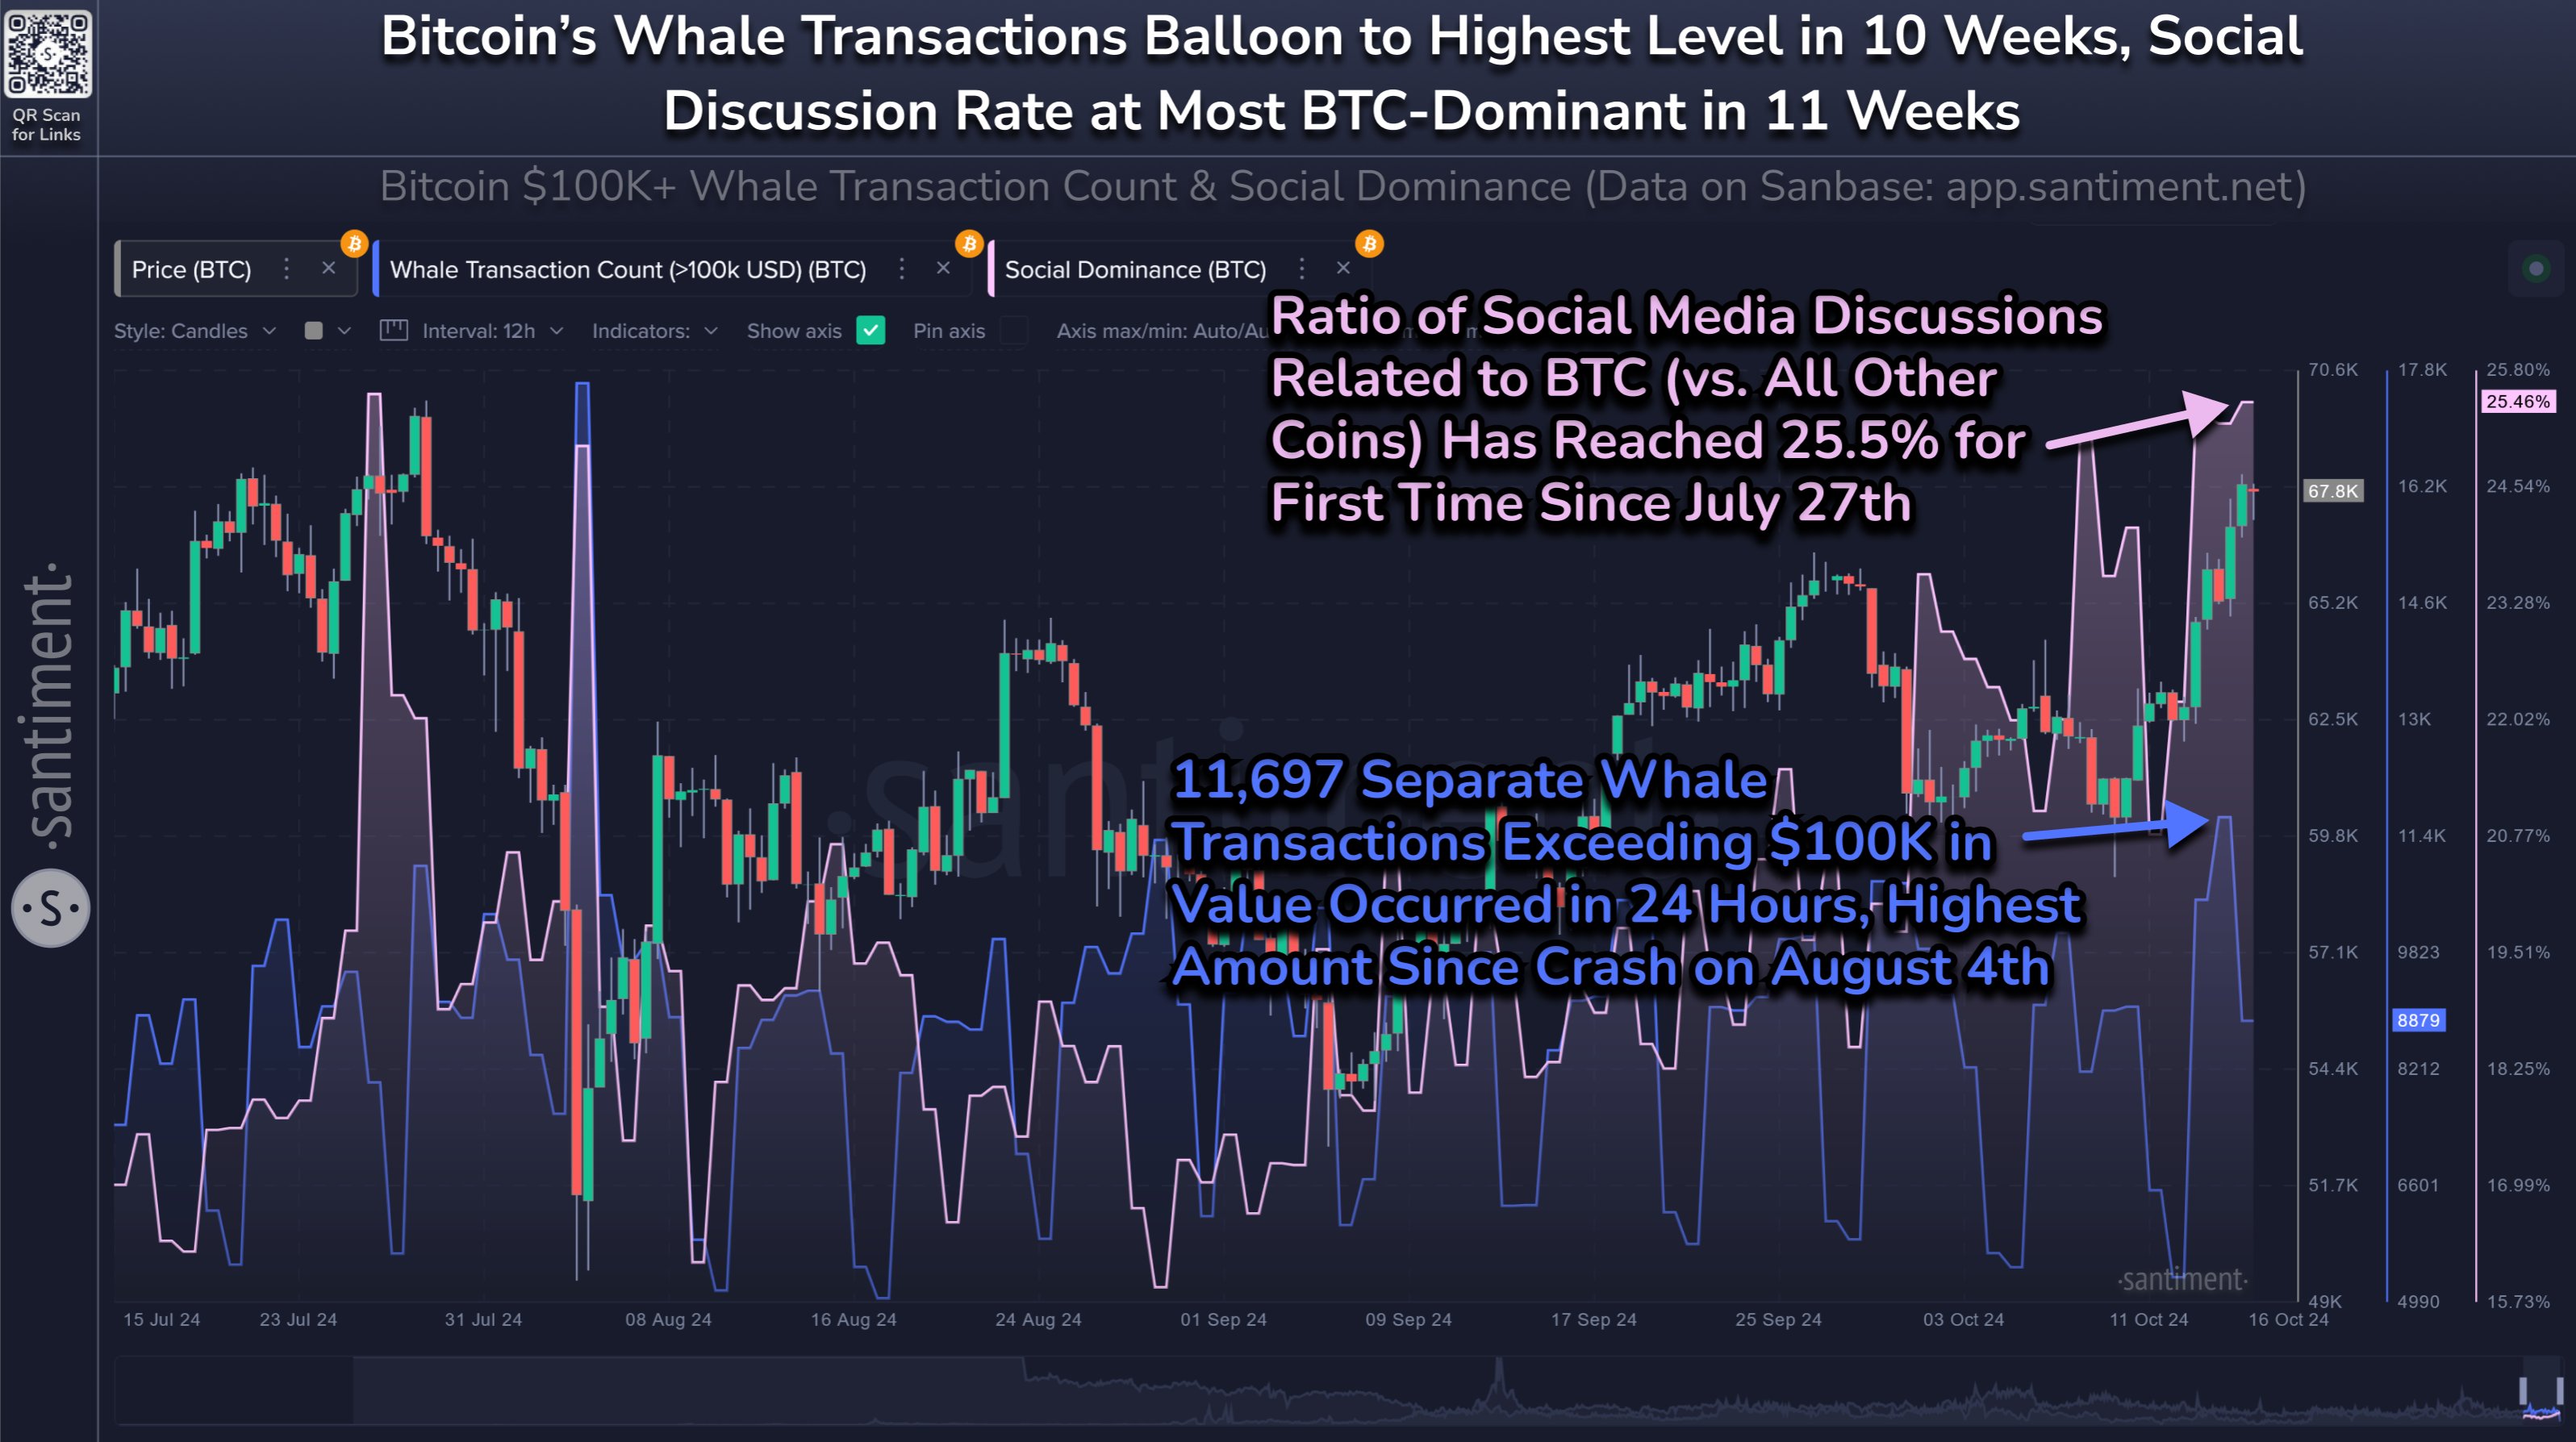
Now here is a chart showing the trend in the number of Bitcoin whale transactions over the past few months:
As you can see in the graph above, there has been a noticeable surge in Bitcoin whale trading volume recently, suggesting that the whales have been making large transfers. Notably, at its peak, this massive entity made a total of 11,697 transmissions in 24 hours.
In general, it is difficult to tell from whale trading numbers alone exactly what kind of migration activity whales are engaging in. Because from an indicator perspective, both sell and buy transactions look the same. But the accompanying price action may offer some hints.
The indicator’s latest high is the highest the indicator has achieved since early August. The surge coincided with a slump in asset prices, suggesting that much of the whales’ movements may have been for selling.
The current increase in whale trading volume comes as Bitcoin rebounds, so there is a possibility that whales may engage in profit-taking again. Since the surge occurred, BTC has fallen below $67,000, which could add further evidence to this point.
In the same chart, Santiment also attached data on another BTC indicator: social dominance. This indicator basically tells you what share of social media discussions Bitcoin takes up compared to the total of the top 100 assets in that sector.
Looking at the graph, it is clear that the social dominance of cryptocurrencies has surged to 25.5%, the highest since late July. Therefore, Bitcoin’s awareness share is currently high compared to altcoins.
This is usually a sign of fear of missing out (FOMO) among traders. Historically, too much hype has been a bad sign for BTC, and highs have often followed suit.
“Both of these signals that the rally may be on hold due to profit taking by key stakeholders and high crowd FOMO,” the analytics firm says.
BTC price
As of this writing, Bitcoin is trading at around $66,900, up more than 9% since last week.