

The market staged a strong recovery in the morning, pushing Bitcoin to a new 2023 high of $38,500 as expectations for the spot Bitcoin ETF grew. However, Ethereum failed to achieve this surge as it struggled to approach the psychological level of $2,100. Surprisingly, Ethereum’s price chart is currently showing a mixed pattern, suggesting the possibility of a future breakout.
Whales form profit-seeking emotions
In recent hours, the price of Ethereum has been trending upward, but this rise has triggered an increase in profit-seeking behavior, especially among ‘whales’. Currently in the ICO era, the Ethereum wallet has transferred 3,000 ETH worth $6.19 million to the Kraken exchange.
This early investor, who originally acquired 20,000 ETH for just $6,200 during Ethereum’s initial coin offering, earned an incredible return. As reported by SpotOnChain, Ethereum’s current trading price is $2,055 and the investor realized a profit of over 660,000% from this trade alone.
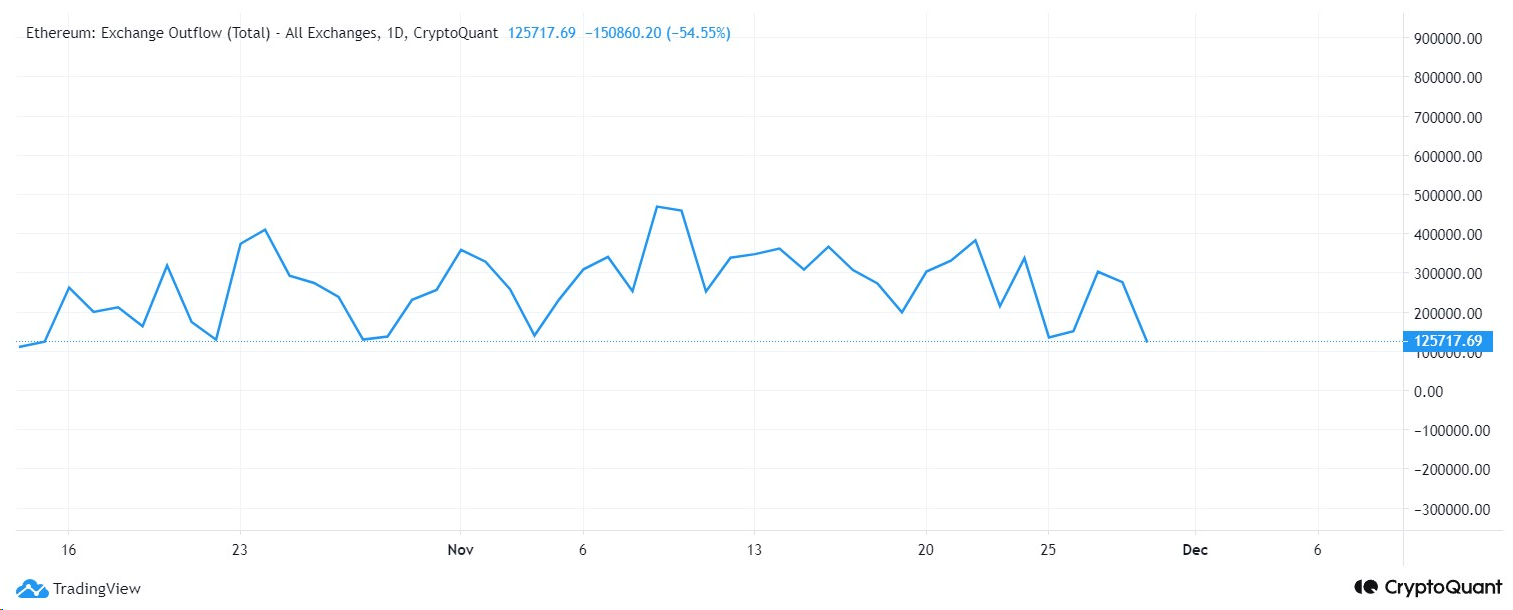
This significant selling could potentially create bearish pressure on Ethereum, especially near resistance levels. Moreover, CryptoQuant’s data indicates a decline in outflows as this indicator recently hit a one-month low. Lower outflows are considered bearish because it means fewer holdings are being withdrawn from exchanges, making holdings and selling more likely.
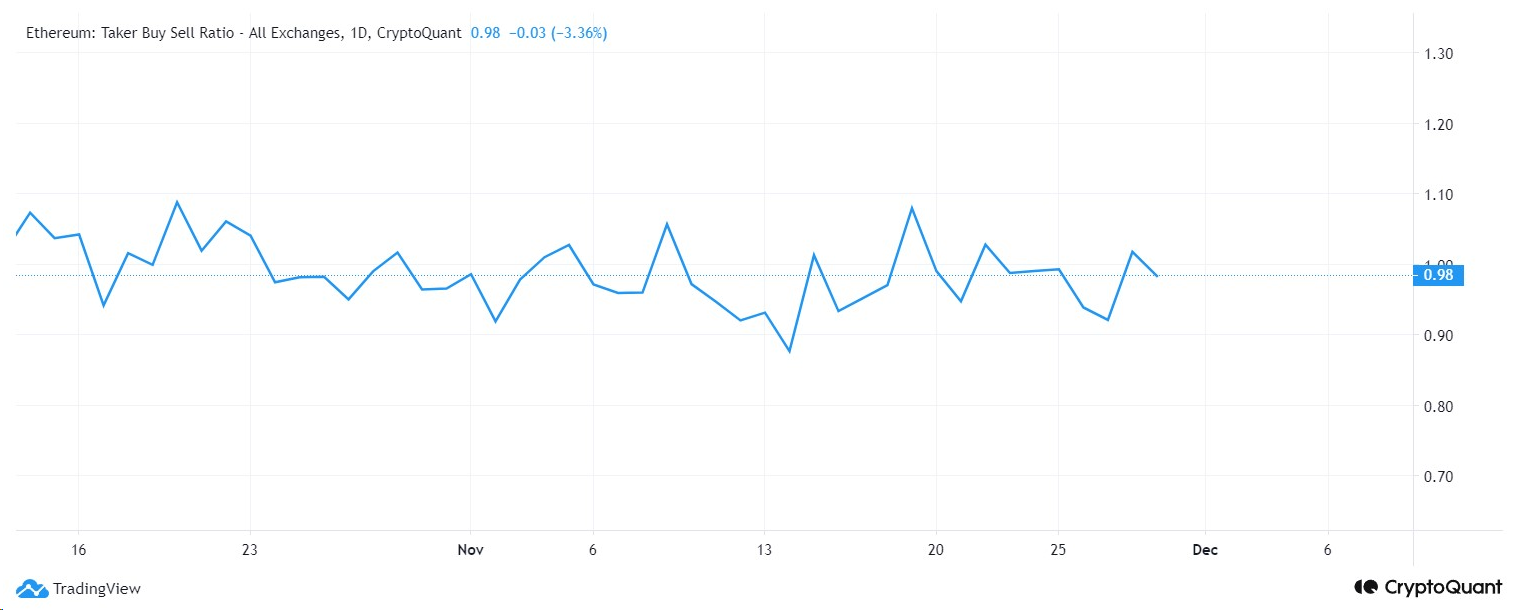
Additionally, large transactions doubled, with metrics increasing from $1.7 billion to $3.6 billion in 24 hours. This means that whale activity has increased during ETH’s price recovery, which could trigger a correction once again. Among these, the taker buy sell ratio is currently trading at 0.98 and is falling. The taker buy-sell ratio is the ratio of buy volume divided by taker sell volume in the perpetual swap market.
A value below 1 means that market participants’ selling volume is exceeding their buying volume, which indicates increasing interest in falling prices.
What’s next for ETH price?
Ethereum recently approached the key resistance level of $2,100, but failed to break through it, which could lead to profit-taking, as evidenced by the long wicks of the day’s candlesticks. Holders are currently recording profits near $2,075. At the time of writing, the price of ETH is trading at $2,047, up more than 0.4% from yesterday.
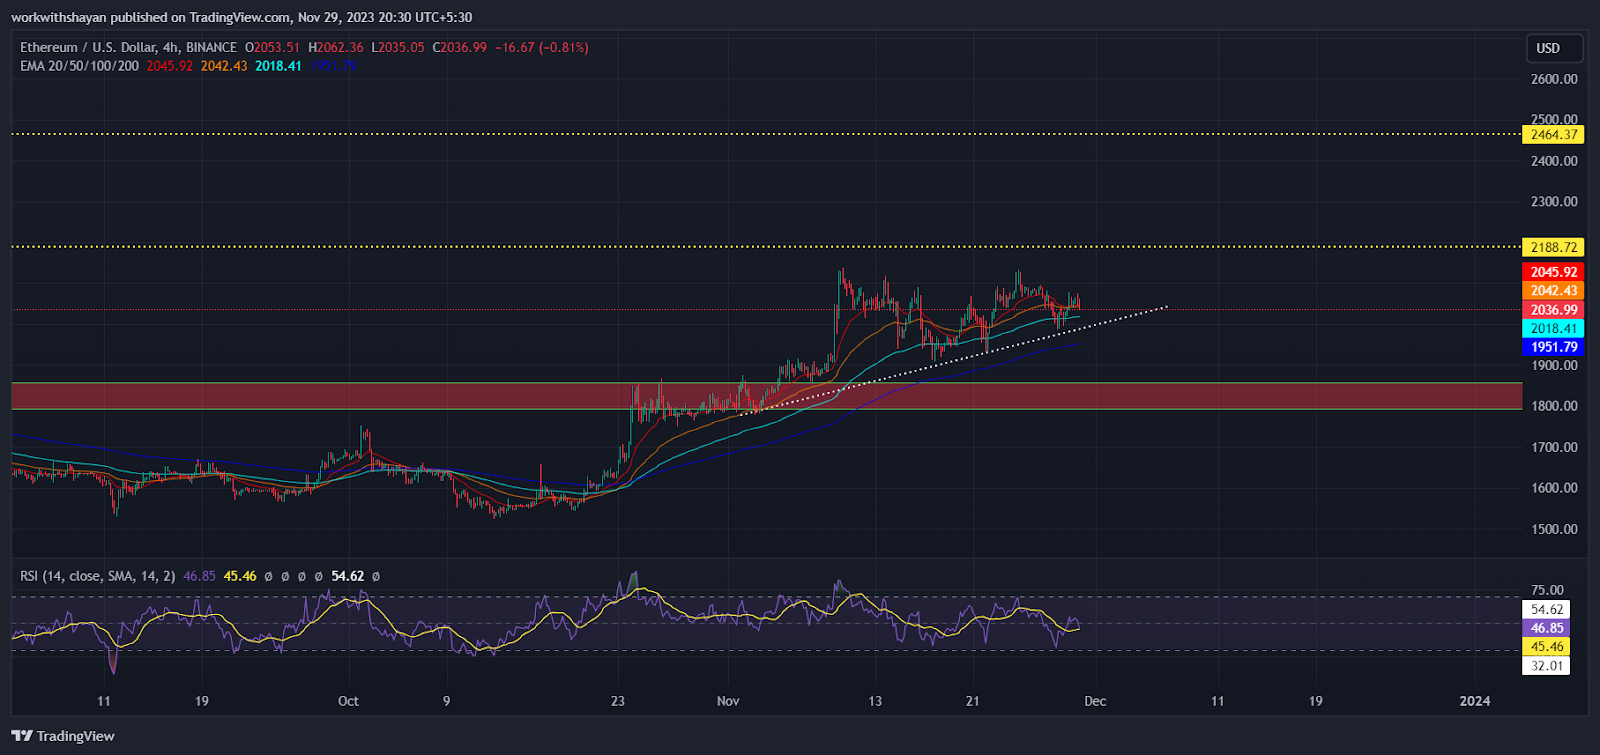
The bears are currently attempting to push Ether’s price below the 20-day exponential moving average (EMA) of $2,046. If successful, ETH price could fall below the $1,985 trend line. A fall below this level would complete a double top pattern, potentially triggering a larger correction towards $1,850. However, buyers will strongly defend against a decline below $1,900.
Conversely, if the price maintains momentum above the 20-day EMA, it means buyers are still attracted by lower prices and the price may move towards the overhead resistance area between $2,138 and $2,188. Buyers must overcome this resistance area to establish an important ascending triangle pattern.