
As this indicator turns bullish, Ethereum may break the bearish consolidation! What’s next for ETH price?

Ethereum continues to trade in bearish consolidation due to Bitcoin’s continued failure to break above the $43,000 to $44,000 range since ETF trading began. Nonetheless, Ethereum has shown notable strength compared to Bitcoin since the market correction, with various on-chain indicators showing positive trends.
Ethereum’s Strong Dominance Over Bitcoin
As you can see from the chart, Bitcoin’s dominance continues to decline while Ethereum is surging. Bitcoin’s dominance has fallen sharply from 55% and is on a five-day losing streak, which is generally seen as a positive sign for altcoins, which could potentially outperform Bitcoin.
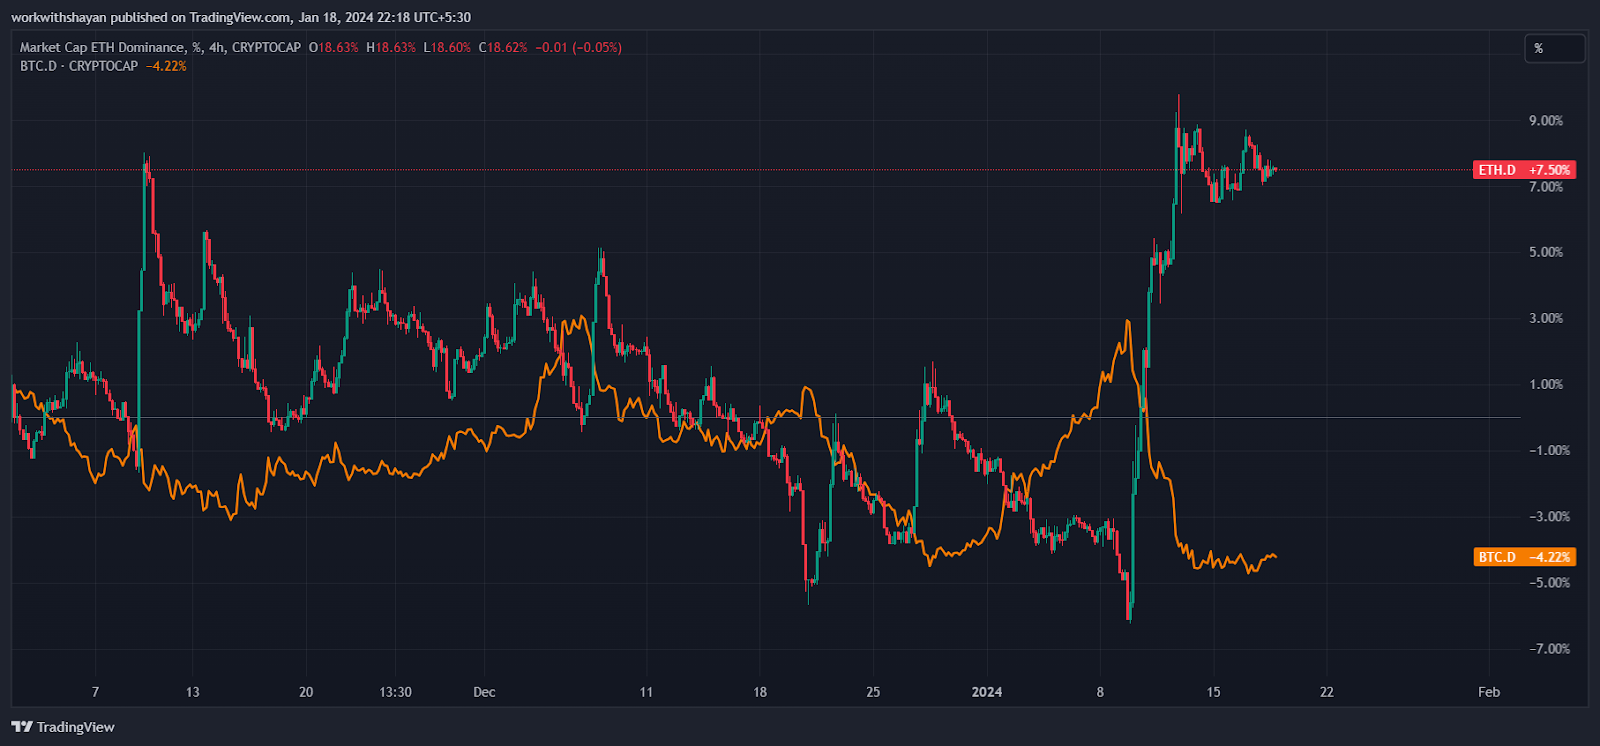
This trend is further evidenced by recent data, which has seen Ethereum’s dominance rise to a three-month high of over 18.5%. On-chain data provider Santiment reported a significant increase in Ethereum’s price dominance over Bitcoin, up 22.4% in the past week.
This period saw a notable increase in participation in the Ethereum network, with approximately 90,000 new Ethereum addresses being created every day, demonstrating the growing appeal of the network. What is particularly surprising is that a whopping 96,300 wallets were created on January 16th.
Ethereum has been working on a number of network improvements recently, with the latest upgrade to the Ethereum network codenamed “Cancun-Deneb” or “Dencun” being released to the Goerli testnet for the first time yesterday.
Once deployed on mainnet, as the developers claim, the Dencun upgrade is expected to significantly reduce transaction costs for Ethereum’s layer 2 solutions such as Optimism, Base, Polygon zkEVM, and others. This upgrade also limits self-destruct operations and introduces new features for bridges and staking pools.
Thanks to active network upgrades, ETH price is maintaining investor confidence and has outperformed Bitcoin impressively. According to Tradingview, the ETHBTC rate has also surged, currently maintaining momentum at 0.06.
What’s next for ETH price?
Ether is currently experiencing a correction phase within a triangle pattern, with buyers aiming to keep the ETH price above $2,450. However, the downtrend continues to dominate, with the price recently falling below $2,500. At the time of writing, ETH is trading at $2,473, down more than 2% from yesterday’s price.
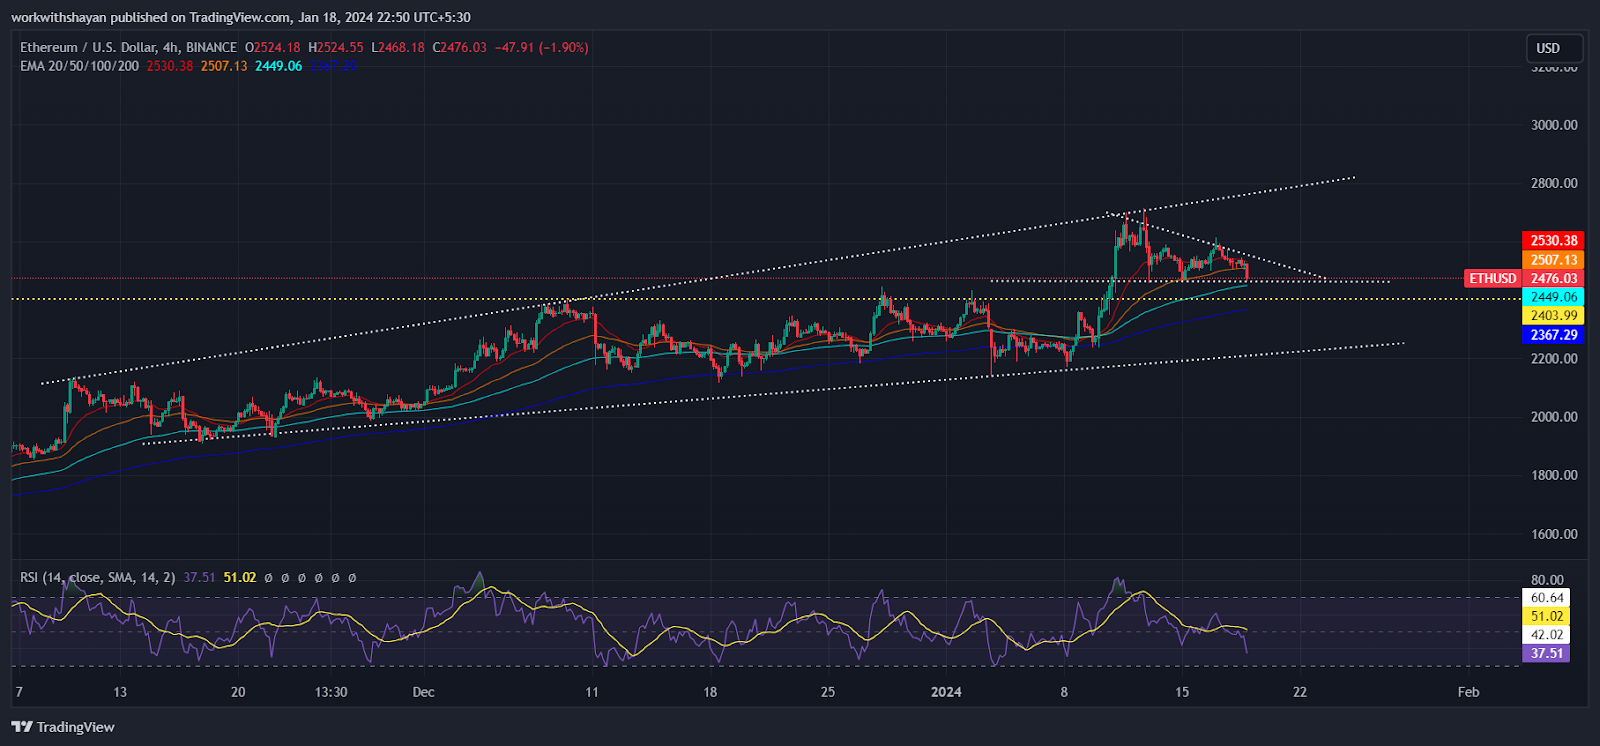
The 20-day Exponential Moving Average (EMA) falling to $2,530 and the Relative Strength Index (RSI) heading into selling territory suggest that market momentum is tilting towards the sellers.
If the current value reverses or rebounds in the $2,400-$2,450 area, it would indicate a strong inclination to buy during the downturn. In this situation, the ETH/USDT pair could potentially surge and break the $2,600 pattern. A breach of this threshold could pave the way for a retest of the $2,700 level.
Conversely, if the price continues its downward trend below $2,400, this bullish scenario could be invalidated in the near term. Such a decline could lead the price towards the important support zone of $2,130-$2,200.