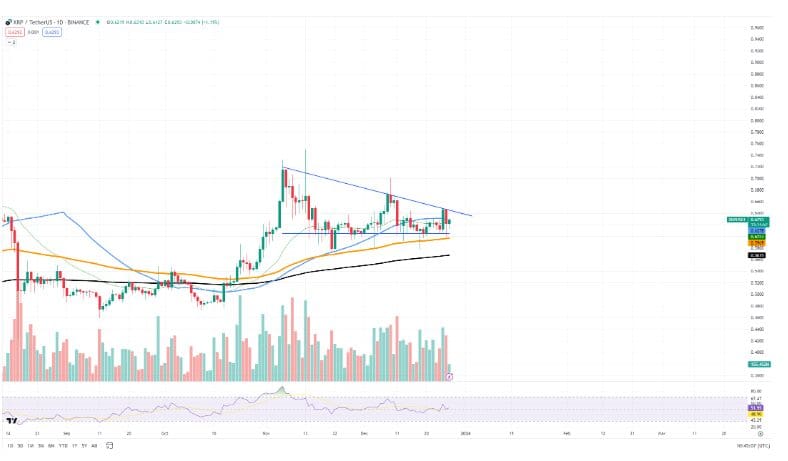
- XRP on the verge of a major price move due to an imminent breakout of the descending triangle pattern.
- Technical analysis of XRP examines support, resistance levels and reveals potential price volatility and direction changes.
Decoding important chart formations for XRP
December 29th, XRP, the digital asset often associated with Ripple, is at a critical juncture that could signal a significant change in its trajectory. This expectation stems from an interesting technical aspect, namely the formation observed on the XRP/USDT price chart, which suggests an imminent breakout in the descending triangle pattern.
Analysis of XRP’s chart dynamics
Chart analysis indicates that there is a descending triangle on XRP’s daily chart. It features a horizontal lower boundary that acts as a solid support level and a downward upper boundary that symbolizes a downward resistance level. Typically, this pattern represents accumulation during a phase of uncertainty as prices consolidate towards the convergence of these boundaries. As XRP approaches this convergence point, the odds of a decisive move are amplified.

Also Read: Ripple (XRP) Prediction: 100% Surge Predicted Before Bitcoin Halving
Key support and resistance levels
For XRP, it remains important to stay above the critical support level around $0.55. This level has shown resilience to bearish pressure in previous instances, potentially strengthening the possibility of an upside breakout. Conversely, a breach below this critical support could push the price of XRP lower, testing the lower support area around the $0.50 area, an area that has historically seen notable buying activity.
Resistance levels also play a role. Immediate resistance near the upper border of the triangle is around $0.63. A strong break above this resistance could push the price of XRP towards the $0.65 level, which has characterized previous price congestion. A break above this mark could pave the way for a test of higher resistance levels around $0.70.
Exploring Market Expectations
As December 29th approaches, tensions are palpable and volatility levels soar. These expectations suggest that market activity will strengthen following the holiday season. Considering that breakouts from these patterns often trigger rapid and significant price movements. Investors should prepare for a potential test of strength if an uptrend appears, and a reassessment of medium-term sentiment if a downtrend occurs.

