Understanding Dogecoin’s Current Market Position
Cryptocurrency enthusiasts and futures market investors often rely on technical analysis to identify market trends. middle Dogecoin’s It is currently trading at $0.07678, and a closer look at the technical environment reveals important support and resistance levels that shape its near-term trajectory.
Chart analysis and support-resistance levels on daily charts
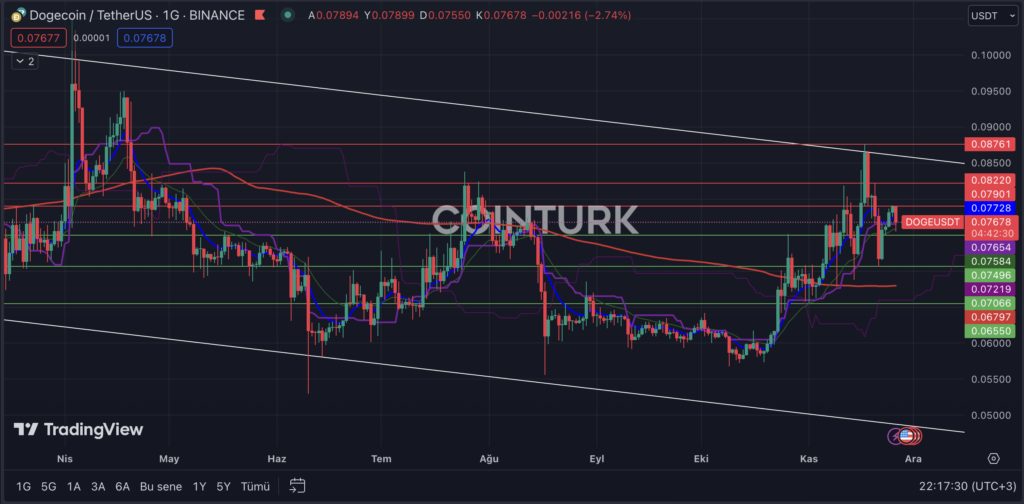
A look at Dogecoin’s daily chart reveals a noticeable descending channel pattern. Recent attempts to move higher have been met with significant resistance, resulting in increased selling pressure as the channel takes effect. The impending direction will depend on support or a breakout within this limited range. Continued positioning below EMA 7 (blue line) could indicate a bearish trend.
On the daily chart, major supports for DOGE are lined up at $0.07496, $0.07066, and $0.06550. A decisive daily close below $0.07066, the pivotal level of the recent correction, could intensify selling activity.

Conversely, the important resistance levels for DOGE on the daily chart are located at $0.07901, $0.08220, and $0.08761. A decisive daily break above the $0.08761 level, which has not been reached during the recent uptrend, could signal a breakout and reinvigorate the bullish momentum.
Also Read: Dogecoin Price Prediction for 2024, 2025, 2030
In-depth insights from Dogecoin’s 2-hour chart
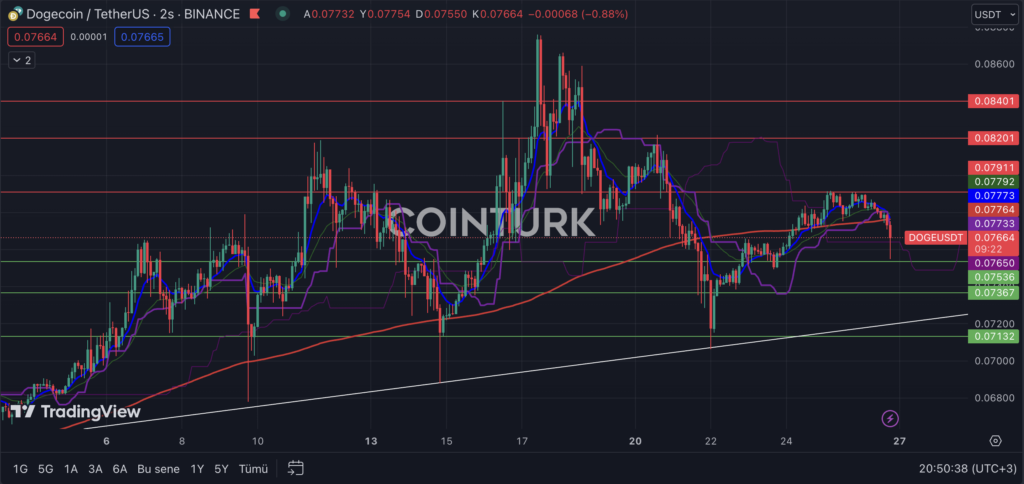
A detailed analysis of Dogecoin’s 2-hour chart highlights the establishment of an important support trendline. The consistent relevance of this trend line during notable selloffs highlights its importance, especially for futures market participants. Monitoring this line is pivotal for market participants navigating DOGE’s price movements.
Key supports on the 2-hour chart are $0.07536, $0.07367, and $0.07132. A 2-hour close for DOGE below the $0.07132 threshold could signal a trend break and lead to a loss of momentum.
At the same time, noteworthy resistance levels exist at $0.07911, $0.08201, and $0.08401 on the 2-hour chart. A solid daily close, overcoming the significant barrier of $0.07911, could trigger a positive momentum change for DOGE.


