
In this article, we look at some neutral candles and how they can predict cryptocurrency trading performance.
Peonza o Spinning Top
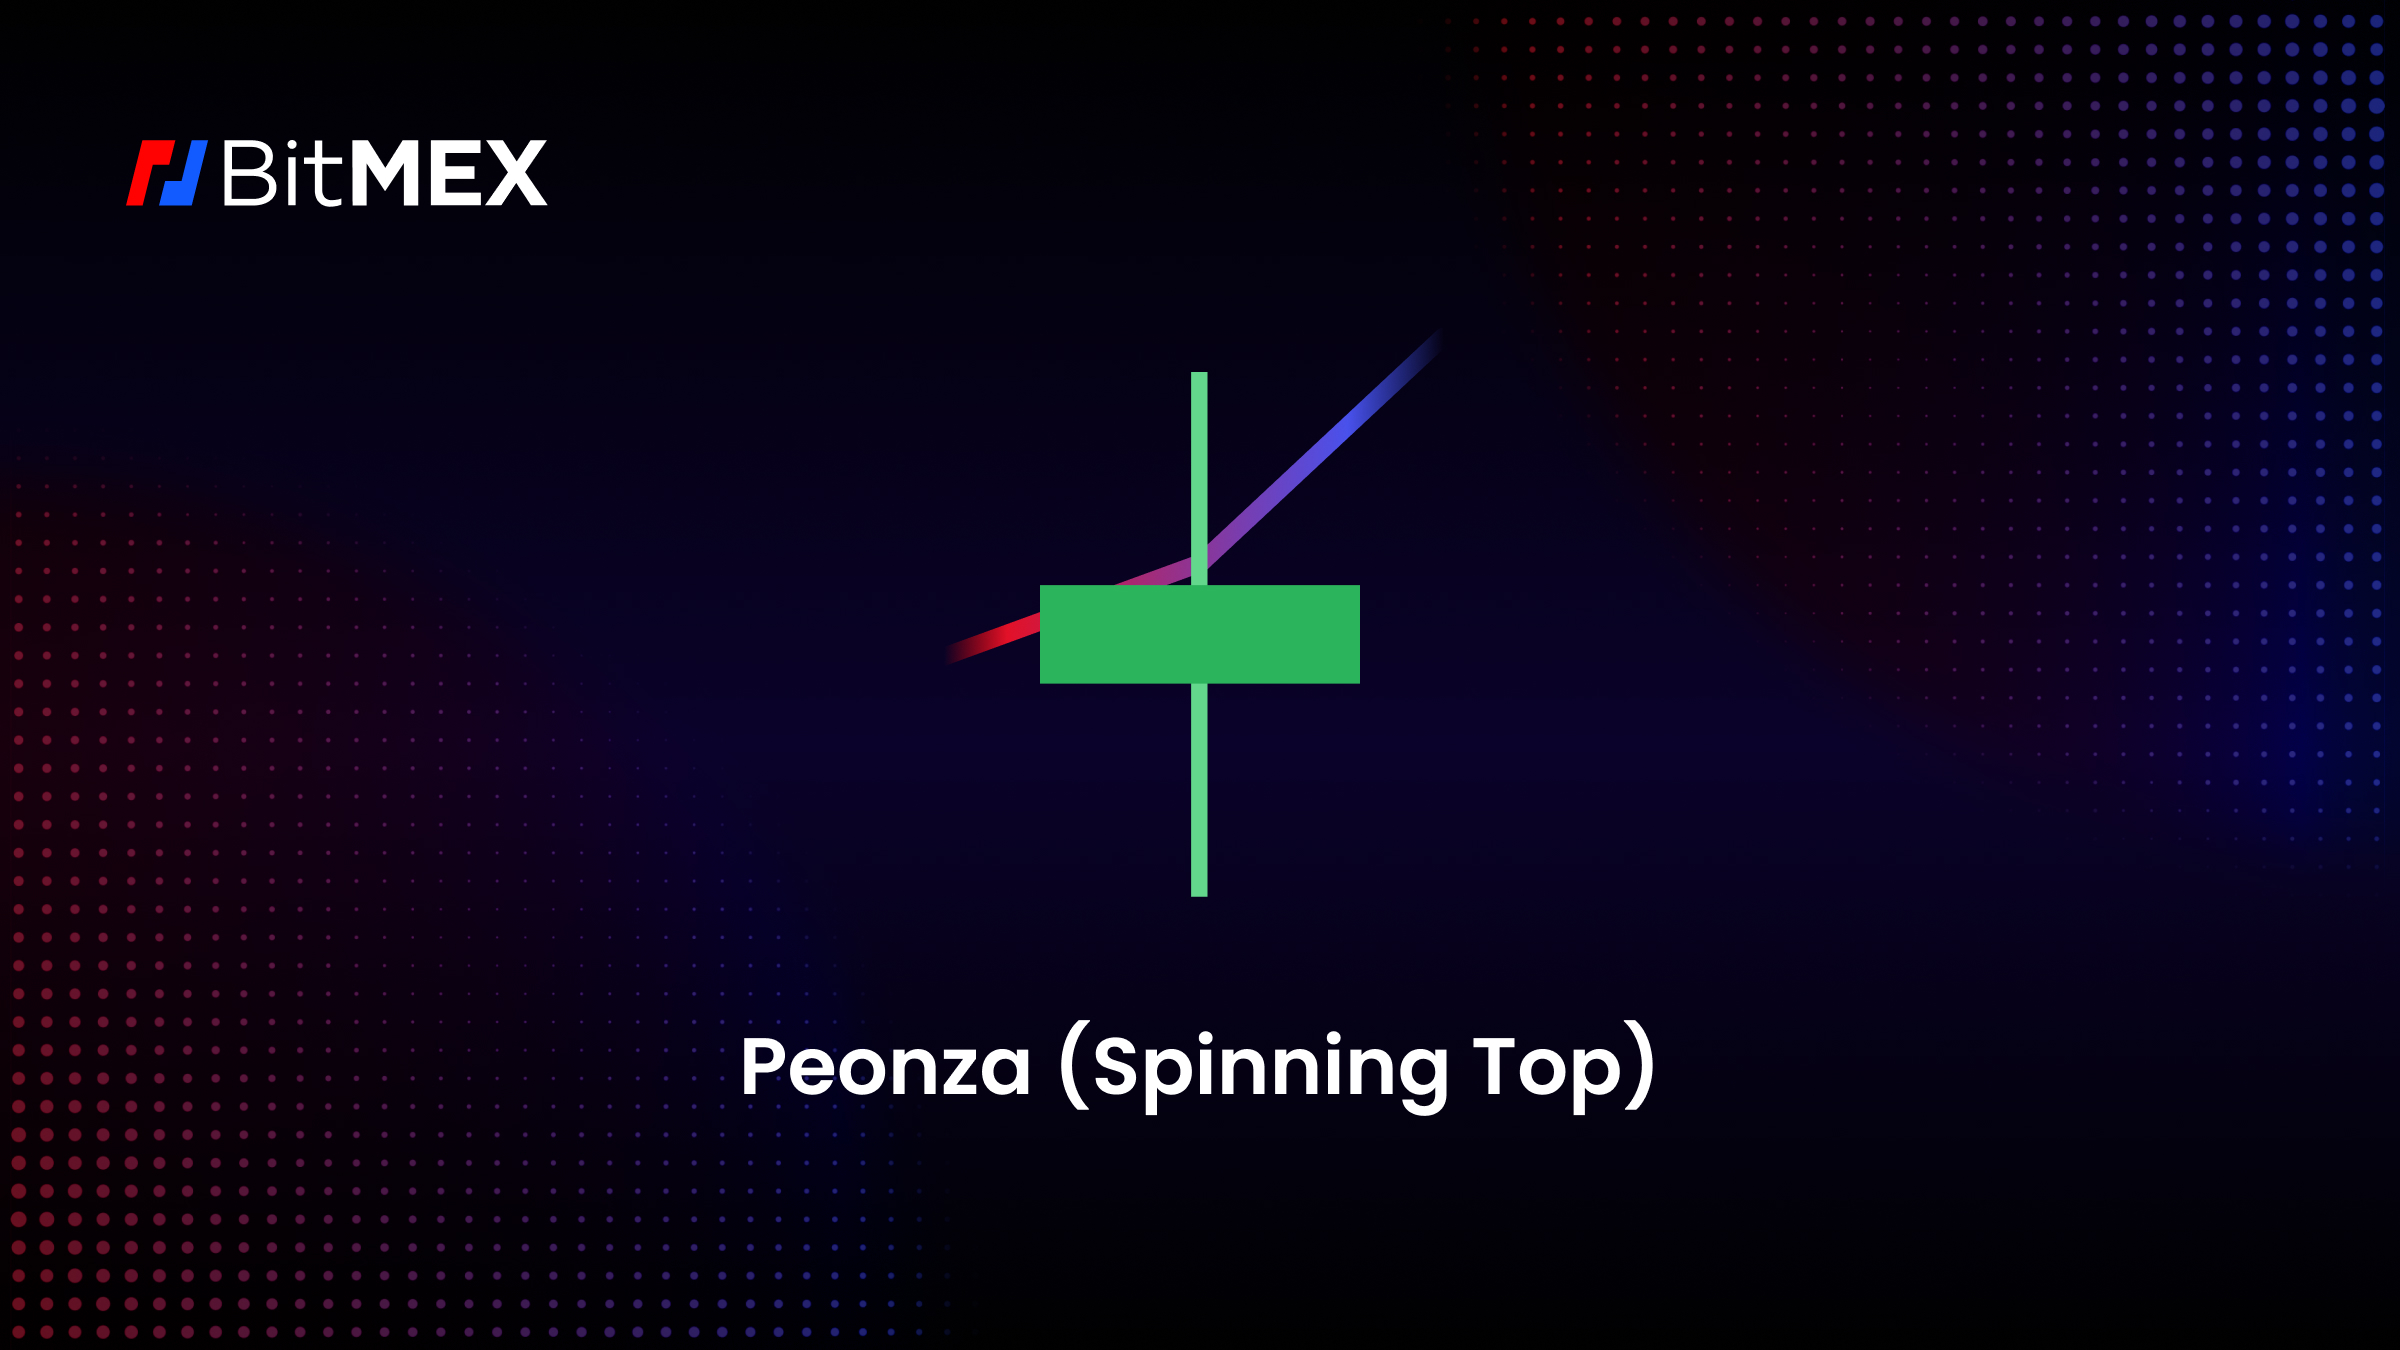
A top is a candle pattern that symbolizes market indecision, with open and close prices close to each other and identified by short wicks at both the top and bottom.
What are the indicators of a top pattern?
- A candle with a small body.
- The candle is green so the close is > open (bullish) or red so it is open > close.
- Make sure the length of the top and bottom shadows is balanced.
How to interpret a top pattern?
This means that fluctuations and control between buyers and sellers in the market determine price outcomes. The striking shape of this pattern makes it easy for even beginners to detect and provides a clear visual indication of a potential trend change.
What is the direction of the top pattern?
The body at the top of a bull market is small and the closing price is higher than the initial price. In this situation, the direction of the high is bullish. This means that despite some volatility and indecision during the trading session, buyers pushed prices slightly higher. The opposite applies if the closing price is lower than the opening price.
period
The top of a long-term chart (e.g. daily or weekly) can be more important than a short-term chart (e.g. intraday).
doji
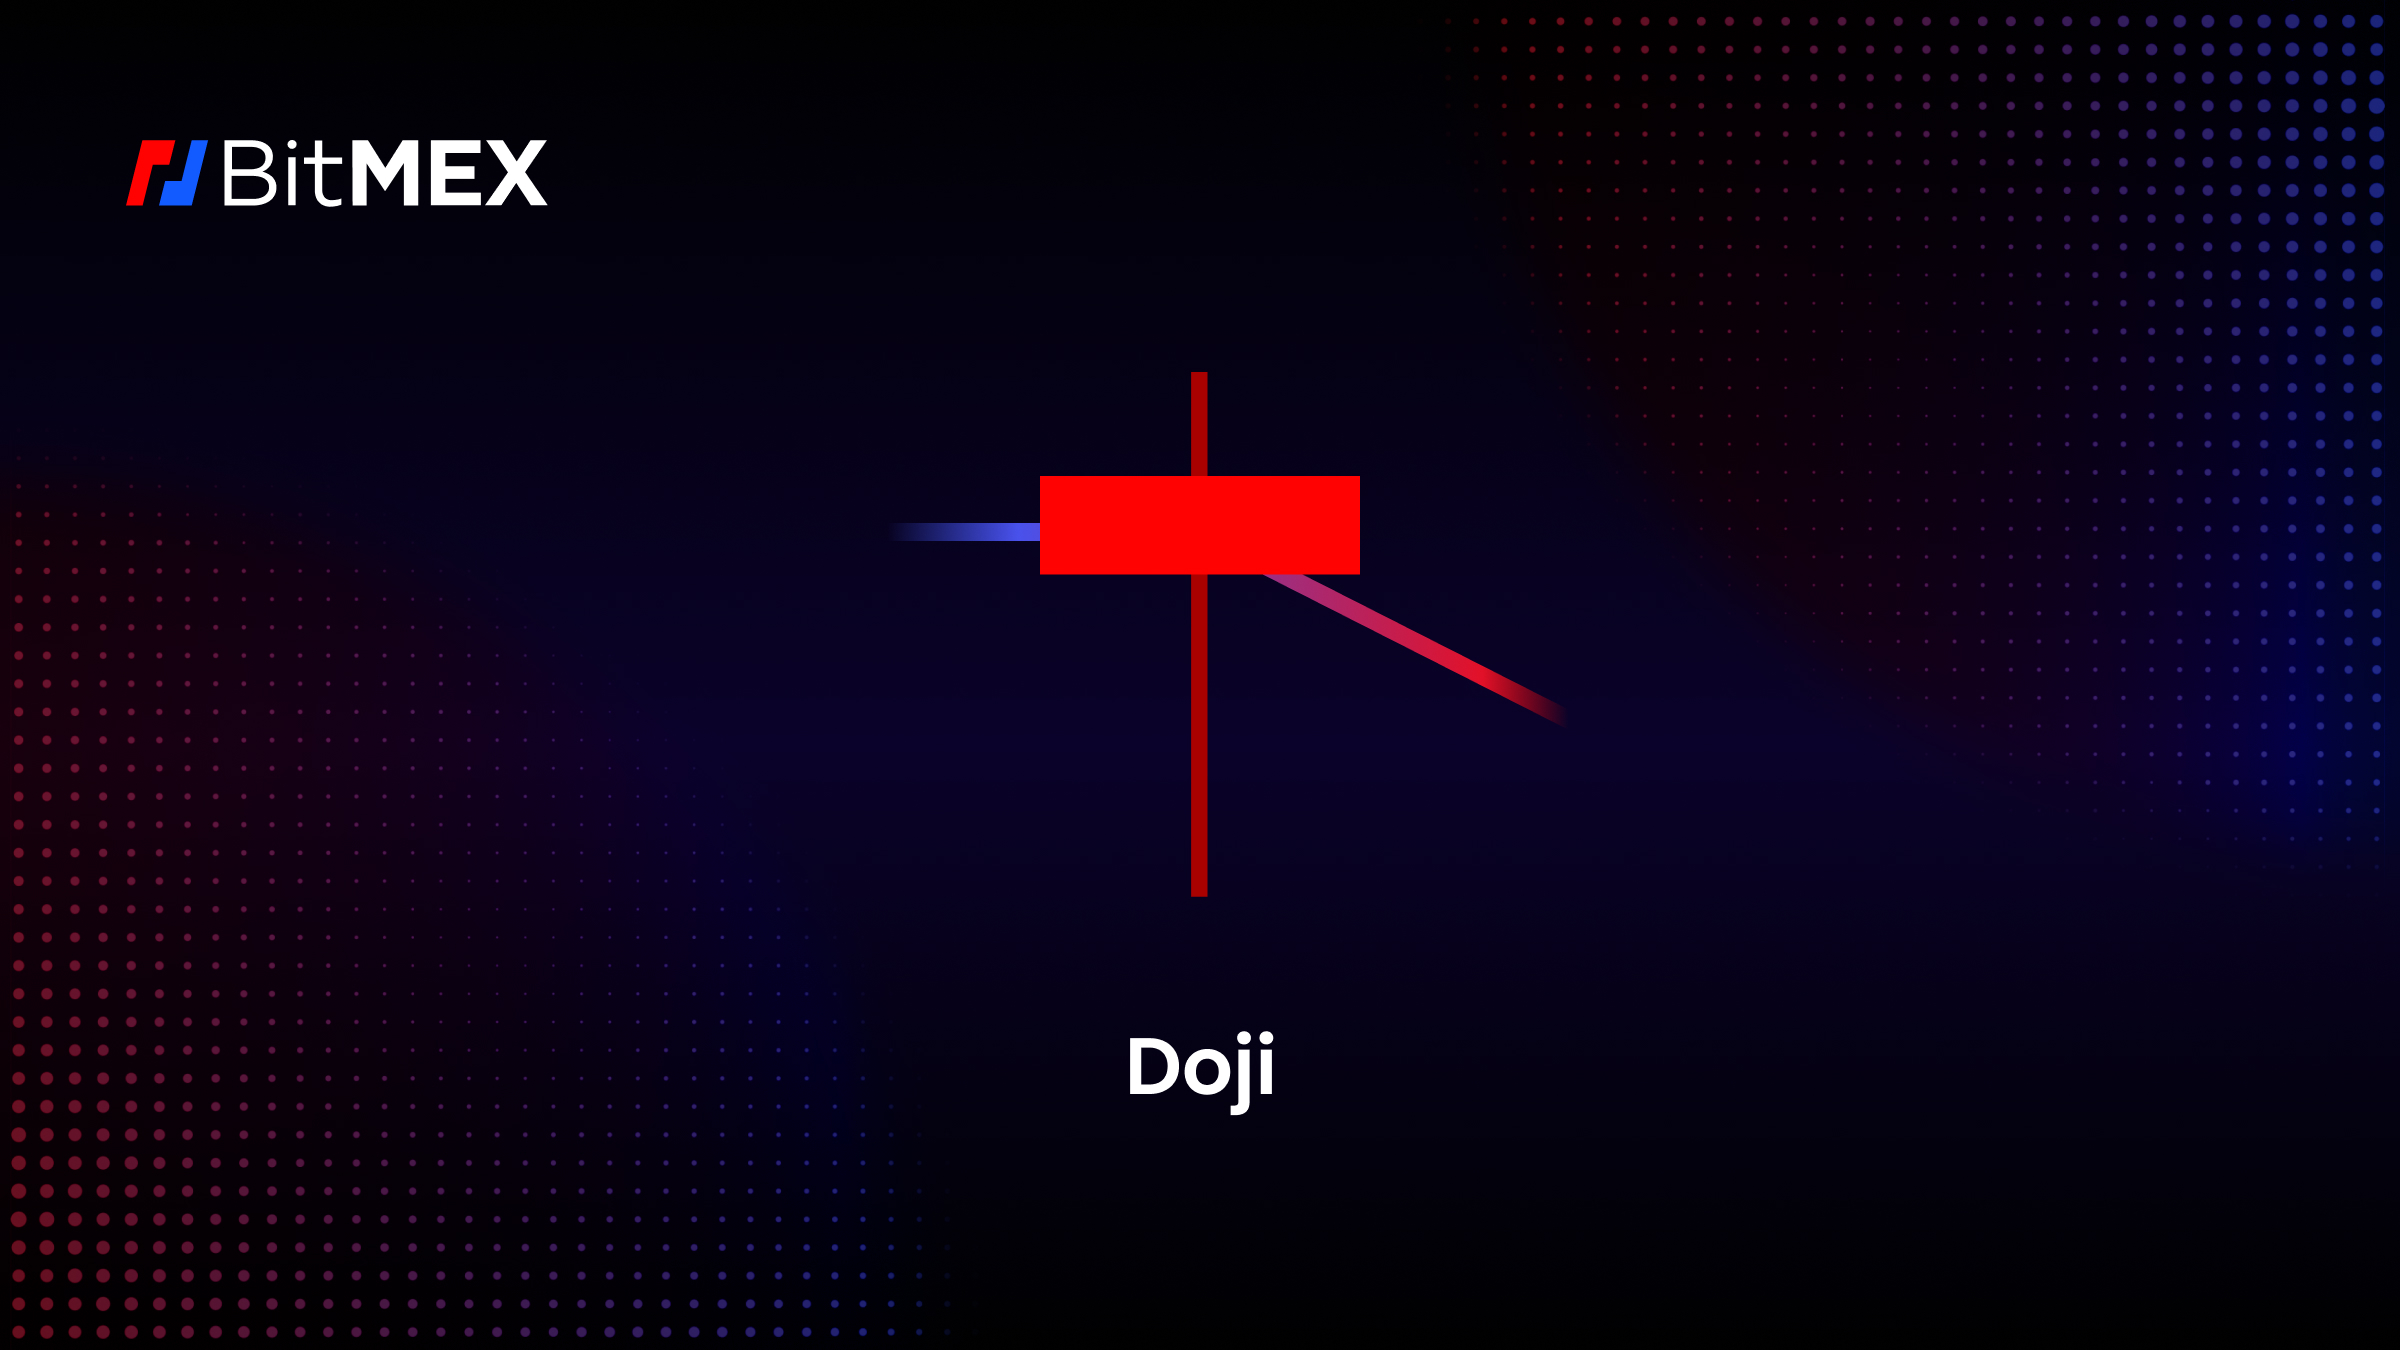
A Doji is a candle pattern that can indicate a change in trend where the opening and closing prices are very close to each other. In many cases, this may indicate market indecision.
What is an indicator of a doji pattern?
- Candles with small or non-existent bodies.
- You have to pay attention to the context.
- Bullish Doji: A stock whose open and close prices are near the bottom of a candle range.
- Bearish Doji: The opening and closing price are also close, but near the top of the candle’s range.
- You need to make sure that the lengths of the upper and lower shadows are balanced.
How to interpret a doji pattern?
This pattern indicates that there is no dominant swing between buyers and sellers in determining a clear price direction.
Advanced traders value the importance of this pattern because it shows a state of uncertainty in the market, followed by a trend change or price continuation, and can complement their strategies.
What is the direction of the doji pattern?
Doji Neutral: Opening and closing are almost identical, which represents a perfect balance in the market.
Doji Bullist: Opening lower than the closing price and green body indicates that bullish momentum is possible, with bulls pushing the price higher at the closing price despite some selling pressure.
Doji bajista: The opening price is greater than the closing price and the body of the candle is usually red. Despite some buying interest, sellers pushed prices lower at the close, indicating there may be bearish momentum.
check
Candlesticks that follow a Doji pattern are one of the most common ways to confirm this. A bullish candle that closes higher than the Doji can confirm the possibility of a bullish reversal, and vice versa for a bearish candle.
half
Harami is a candle pattern in technical analysis characterized by the presence of a smaller candle within the body of a larger candle.
What are the indicators of harami pattern?
- Two candles positioned similarly or within exactly the same range.
- The first candle is either green, so close > open (bullish), or red, so open > close.
- The lengths of the top and bottom shadows are balanced.
How to interpret the Harami pattern?
The Harami pattern means that the market trend may be reversing. It is important to observe the context in which harami patterns appear, and even more so when they follow a well-established trend. The strength of the previous trend determines the potential impact of the pattern. It is important to determine whether Harami is bullish or bearish as it provides information about market trends.
What is the Harami design address?
A bullish harami occurs during a downtrend and indicates a possible upside reversal. This pattern indicates that selling pressure is easing and buyers are taking control, which could lead to a bullish reversal or at least the end of a downtrend. In the case of bearish harami, the opposite occurs. This indicates that buying pressure is easing and sellers are taking control, possibly leading to a reversal to the downside or at least the end of a bullish trend.
check
volume analysis
Increased trading volume during or after the harami pattern may provide additional validation. This is because higher trading volume means market participants have more confidence in the market.
The next article in this series will discuss bearish candles.
Theories aside, if you want to start trading cryptocurrency derivatives or find spots on BitMEX, you can find all the existing products there. here. For more educational materials on BitMEX trading, especially derivatives, please visit: this page.
To be the first to know about new listings, product launches, giveaways, and more, we invite you to join us on: online community Connect with other operators. For the latest information, you can also follow us on: Xor our blog why Advertisements on the site.